| Graphics | |
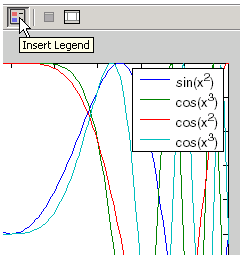
Legends provide a key to the various data plotted on a graph. The following picture shows the legend for a graph of four functions of a variable plotted with lines of different colors. Note how you can assign an appropriate string to each line in the legend.
Add a legend by clicking the legend icon in the toolbar  or by selecting Legend from the Insert menu. When plot editing is enabled, you can select and then move and resize the legend.
You can also use the legend command to add a legend to a graph.
Specifying the Text
By default, the legend labels each plotted object (line, surface, etc.) with the strings data1, data2, etc. You can change this text by double-clicking on the text to enable edit mode. In edit mode, you can retype the text string.
You can use TEX characters in the text strings to produce symbols. You can disable interpretation of characters as TEX sequences by selecting none from the Interpreter submenu of the legend's right-click context menu.
See the the Table of TEX symbols in the Text Properties reference documentation for more information.
Positioning the Legend
There are a number of ways to position the legend.
You can also select a vertical or horizontal orientation for the legend. Use the Orientation item in the context menu to make this selection.
Changing the Appearance of the Legend
You can specify the following legend characteristics from the context menu:
Interpreter property to use TEX or plain text.
| | Adding a Colorbar to a Graph | Pinning -- Attaching to a Point in the Figure | |
© 1994-2005 The MathWorks, Inc.