| Graphics | |
Adding Plots of Basic Statistics to Graphs
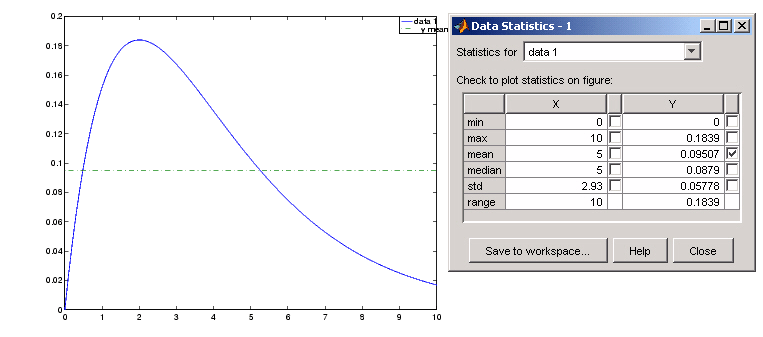
The MATLAB Data Statistics tool calculates basic statistics about the central tendency and variability of data plotted in a graph and then plots these statistics in the same graph.
To obtain statistics, select Data Statistics from the MATLAB figure window Tools menu. MATLAB calculates the statistics for each data set plotted in the graph and displays the results in the Data Statistics dialog box.
For example, the following plot indicates the mean directly on the plot of the distribution.
Saving Statistics to the Workspace
To save a set of statistics as a workspace variable, click the Save to workspace button. The Data Statistics tool saves the statistics as a structure.
Examples
The following sections provide more information about using the Data Statistics tool:
| | Analyzing Graphical Data | Example -- Plotting the Mean of a Data Set | |
© 1994-2005 The MathWorks, Inc.