| Graphics | |
Displaying Multiple Plots per Figure
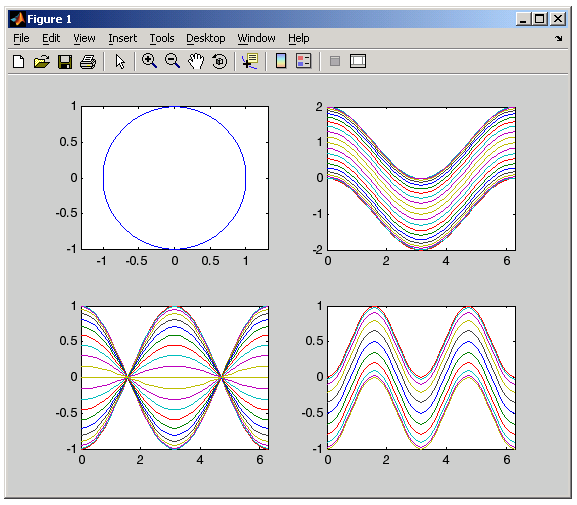
You can display multiple plots in the same figure window and print them on the same piece of paper with the subplot function.
subplot(m,n,i) breaks the figure window into an m-by-n matrix of small subplots and selects the ith subplot for the current plot. The plots are numbered along the top row of the figure window, then the second row, and so forth.
For example, the following statements plot data in four different subregions of the figure window.
t = 0:pi/20:2*pi;
[x,y] = meshgrid(t);
subplot(2,2,1)
plot(sin(t),cos(t))
axis equal
subplot(2,2,2)
z = sin(x)+cos(y);
plot(t,z)
axis([0 2*pi -2 2])
subplot(2,2,3)
z = sin(x).*cos(y);
plot(t,z)
axis([0 2*pi -1 1])
subplot(2,2,4)
z = (sin(x).^2)-(cos(y).^2);
plot(t,z)
axis([0 2*pi -1 1])
Each subregion contains its own axes with characteristics you can control independently of the other subregions. This example uses the axis command to set limits and change the shape of the subplots.
See the axes, axis, and subplot functions for more information.
| | Figure Windows | Specifying the Target Axes | |
© 1994-2005 The MathWorks, Inc.