
| Graphics |   |
Adding a Subplot
Add a second axes below the current axes using the New Subplots panel. Click the right-facing arrowhead next to 2D Axes and move the mouse to darken two squares, one on top of the other. This creates a subplot axes below the existing axes. MATLAB resizes the existing axes so both fit in the figure.
Once MATLAB inserts the new axes, select its entry in the Plot Browser and then click Add Data.
When the Add Data to Axes dialog is displayed, enter the following values:
x.
sin(x).^3.
Now add another plot overlaid on the first by clicking Add Data again and specify the data to plot:
x.
sin(x).^9.
Select the plot labeled sin(x).^9 under the second axes in the Plot Browser. Set the Plot Type in the Property Editor to Area.
Setting Axis Limits
Adjust the x-axis in both axes using the Property Editor.
Repeat these steps for the second axes.
Adding Titles and Labels
Select the first axes in the Plot Browser and set the following properties in the Property Editor:
Even Powers.
Set X Label to X.
Sine of X.
Select the second axes in the Plot Browser and set the following properties in the properties panel:
Odd Powers.
Sine of X.
Sine of X.
Note that the Plot Browser reflects the new axes names.
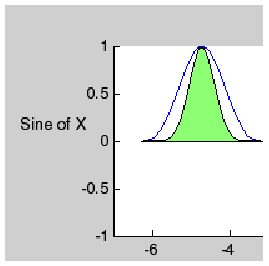
The following picture shows the result of these steps.
Select the text of the y-axis label on the first axes (now labeled Even Powers in the Plot Browser) and click the Inspector button on the Property Editor. Set the Rotation property to 0 and reposition the text by hand.
To make more space for the y-axis label, which is now in a horizontal position, select the axes and move it to the right with the mouse.
Repeat this process for the second axes (labeled Odd Powers in the Plot Browser).
The repositioned text label now looks like the following picture.

 | Example -- Working with Plotting Tools | Example -- Plotting Workspace Variables |  |
© 1994-2005 The MathWorks, Inc.