| Desktop Tools and Development Environment |
  |
Profile Summary Report
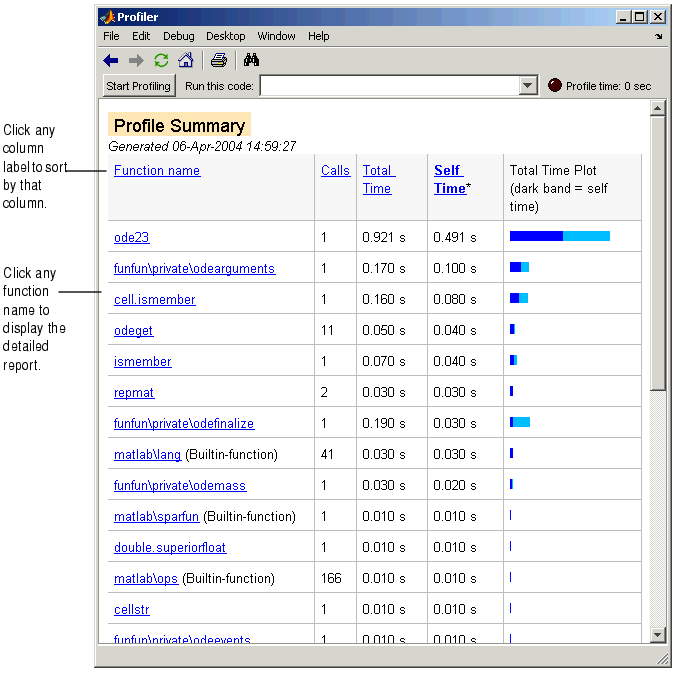
The Profile Summary report presents statistics about the overall execution of the function and provides summary statistics for each function called. The report formats these values in four columns.
- Function Name--A list of all the functions and subfunctions called by the profiled function. When first displayed, the functions are listed in order by the amount of time they took to process. To sort the functions alphabetically, click the Function Name link at the top of the column.
- Calls--The number of times the function was called while profiling was on. To sort the report by the number of times functions were called, click the Calls link at the top of the column.
- Total Time--The total time spent in a function, including all child functions called, in seconds. The time for a function includes time spent on child functions. To sort the functions by the amount of time they consumed, click the Total Time link at the top of the column. By default, the summary report displays profiling information sorted by Total Time. Note that the Profiler itself uses some time, which is included in the results. Also note that total time can be zero for files whose running time was inconsequential.
- Self Time--The total time spent in a function, not including time for any child functions called, in seconds. To sort the functions by this time value, click the Self Time link at the top of the column.
Following is the summary report for the Lotka-Volterra model described in Example: Using the profile Function.
To print a summary report, click the Print button  .
.
To get more detailed information about a particular function, click its name in the Function Name column. See Profile Detail Report for more information.

 | Running the Profiler | | Profile Detail Report |  |
© 1994-2005 The MathWorks, Inc.


 .
. 
