| MATLAB Function Reference | |
Syntax
Description
plotmatrix(X,Y)
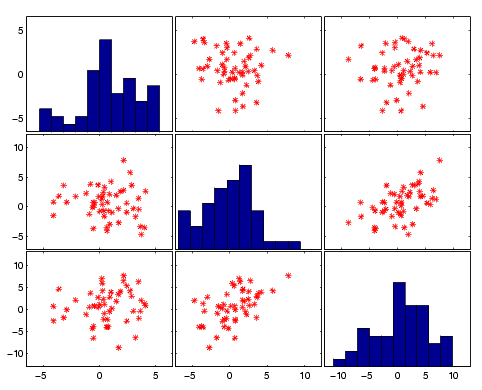
scatter plots the columns of X against the columns of Y. If X is p-by-m and Y is p-by-n, plotmatrix produces an n-by-m matrix of axes. plotmatrix(Y) is the same as plotmatrix(Y,Y) except that the diagonal is replaced by hist(Y(:,i)).
plotmatrix(...,'LineSpec')
uses a LineSpec to create the scatter plot. The default is '.'.
[H,AX,BigAx,P] = plotmatrix(...)
returns a matrix of handles to the objects created in H, a matrix of handles to the individual subaxes in AX, a handle to a big (invisible) axes that frames the subaxes in BigAx, and a matrix of handles for the histogram plots in P. BigAx is left as the current axes so that a subsequent title, xlabel, or ylabel command is centered with respect to the matrix of axes.
Examples
Generate plots of random data.
See Also
| | plotedit | plottools | |
© 1994-2005 The MathWorks, Inc.