| MATLAB Function Reference | |
Syntax
Description
ribbon(Y)
plots the columns of Y as separate three-dimensional ribbons using X = 1:size(Y,1).
ribbon(X,Y)
plots X versus the columns of Y as three-dimensional strips. X and Y are vectors of the same size or matrices of the same size. Additionally, X can be a row or a column vector, and Y a matrix with length(X) rows.
ribbon(X,Y,width)
specifies the width of the ribbons. The default is 0.75.
ribbon(axes_handle,...)
plots into the axes with handle axes_handle instead of the current axes (gca).
h = ribbon(...)
returns a vector of handles to surface graphics objects. ribbon returns one handle per strip.
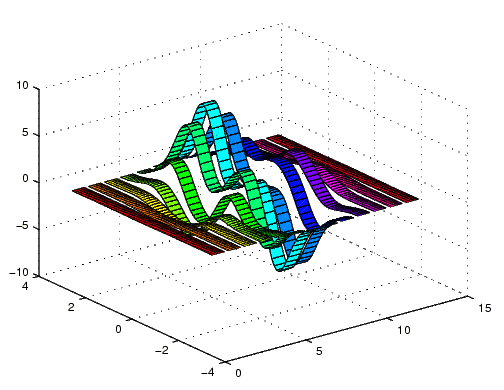
Examples
Create a ribbon plot of the peaks function.
See Also
plot, plot3, surface, waterfall
Polygons and Surfaces for related functions
| | rgbplot | rmappdata | |
© 1994-2005 The MathWorks, Inc.