| 3-D Visualization | |
If you specify the x-, y-, and z-coordinate arguments as vectors, MATLAB draws a single polygon by connecting the points. If the arguments are matrices, MATLAB draws one polygon per column, producing a single patch with multiple faces. These faces need not be connected and can be self-intersecting.
Alternatively, you can specify the coordinates of each unique vertex and the order in which to connect them to form the faces. The examples in this section illustrate both techniques.
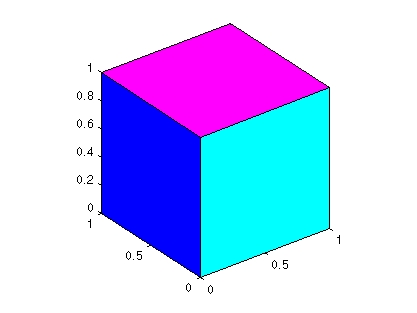
Example -- Defining a Cube
A cube is defined by eight vertices that form six sides. This illustration shows the coordinates of the vertices defining a cube in which the sides are one unit in length.
Specifying X, Y, and Z Coordinates
Each of the six faces has four vertices. Because you do not need to close each polygon (i.e., the first and last vertices do not need to be the same), you can define this cube using a 4-by-6 matrix for each of the x-, y-, and z-coordinates.
Each column of the matrices specifies a different face. Note that while there are only eight vertices, you must specify 24 vertices to define all six faces. Since each face shares vertices with four other faces, you can define the patch more efficiently by defining each vertex only once and then specifying the order in which to connect these vertices to form each face. The patch Vertices and Faces properties define patches in just this way.
These matrices specify the cube using Vertices and Faces.
Using the vertices/faces technique can save a considerable amount of computer memory when patches contain a large number of faces. This technique requires the formal patch function syntax, which entails assigning values to the Vertices and Faces properties explicitly. For example,
Because the high-level syntax does not automatically assign face or edge colors, you must set the appropriate properties to produce patches with colors other than the default white face color and black edge color.
Flat Face Color
Flat face color is the result of specifying one color per face. For example, using the vertices/faces technique and the FaceVertexCData property to define color, this statement specifies one color per face and sets the FaceColor property to flat.
patch('Vertices',vertex_matrix,'Faces',faces_matrix,...
      'FaceVertexCData',hsv(6),'FaceColor','flat')
Because truecolor specified with the FaceVertexCData property has the same format as a MATLAB colormap (i.e., an n-by-3 array of RGB values), this example uses the hsv colormap to generate the six colors required for flat shading.
Interpolated Face Color
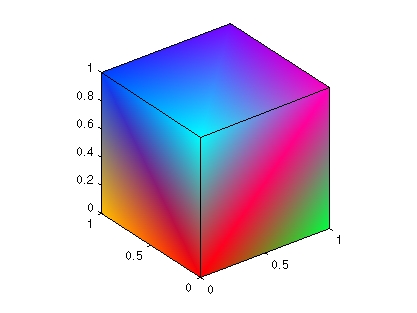
Interpolated face color means the vertex colors of each face define a transition of color from one vertex to the next. To interpolate the colors between vertices, you must specify a color for each vertex and set the FaceColor property to interp.
patch('Vertices',vertex_matrix,'Faces',faces_matrix,...
      'FaceVertexCData',hsv(8),'FaceColor','interp')
Changing to the standard 3-D view and making the axis square,
produces a cube with each face colored by interpolating the vertex colors.
To specify the same coloring using the x, y, z, c technique, c must be an m-by-n-by-3 array, where the dimensions of x, y, and z are m-by-n.
This diagram shows the correspondence between the FaceVertexCData and CData properties.
Specifying Patch Coloring discusses coloring techniques in more detail.
| | Creating a Single Polygon | Specifying Patch Coloring | |
© 1994-2005 The MathWorks, Inc.