| 3-D Visualization | |
Example -- axis Command Options
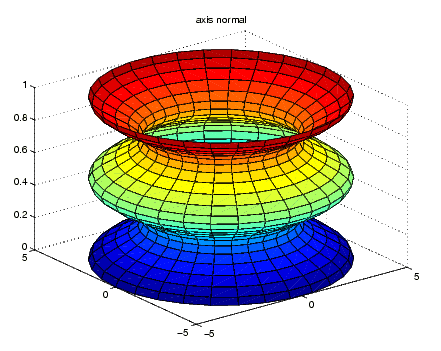
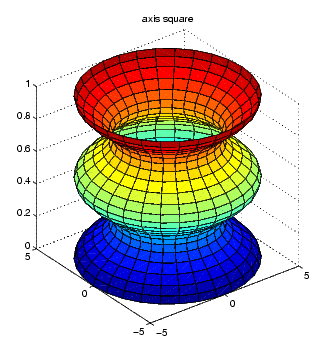
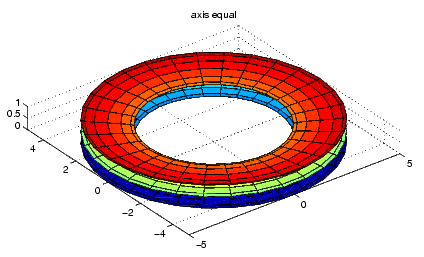
The following three pictures illustrate the effects of three axis options on a cylindrical surface created with the statements
axis normal is the default behavior. MATLAB automatically sets the axis limits to span the data range along each axis and stretches the plot to fit the figure window.
axis square creates an axes that is square regardless of the shape of the figure window. The cylindrical surface is no longer distorted because it is not warped to fit the window. However, the size of one data unit is not equal along all axes (the z-axis spans only one unit while the x-axes and y-axes span 10 units each).
axis equal makes the length of one data unit equal along each axis while maintaining a nearly square plot box. It also prevents warping of the axis to fill the window's shape.
| | Specifying Aspect Ratio | Additional Commands for Setting Aspect Ratio | |
© 1994-2005 The MathWorks, Inc.