| 3-D Visualization | |
Specifying Starting Points for Stream Plots
Stream plots (stream lines, ribbons, tubes, and cones or arrows) illustrate the flow of a 3-D vector field. The MATLAB stream plotting routines (streamline, streamribbon, streamtube, coneplot, stream2, stream3) all require you to specify the point at which you want to begin each stream trace.
Determining the Starting Points
Generally, knowledge of your data's characteristics helps you select the starting points. Information such as the primary direction of flow and the range of the data coordinates helps you decide where to evaluate the data.
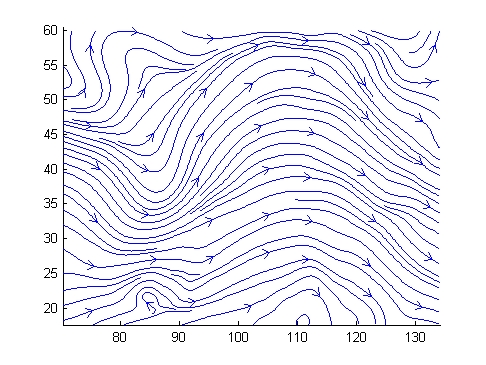
The streamslice function is useful for exploring your data. For example, these statements draw a slice through the vector field at a z value midway in the range.
This stream slice plot indicates that the flow is in the positive x direction and also enables you to select starting points in both x and y. You could create similar plots that slice the volume in the x-z plane or the y-z plane to gain further insight into your data's range and orientation.
Specifying Arrays of Starting-Point Coordinates
To specify the starting point for one stream line, you need the x-, y-, and z-coordinates of the point. The meshgrid command provides a convenient way to create arrays of starting points. For example, you could select the following starting points from the wind data displayed in the previous stream slice.
This statement defines the starting points as all lying on x = 80, y ranging from 20 to 50, and z ranging from 0 to 15. You can use plot3 to display the locations.
You do not need to use 3-D arrays, such as those returned by meshgrid, but the size of each array must be the same, and meshgrid provides a convenient way to generate arrays when you do not have an equal number of unique values in each coordinate. You can also define starting-point arrays as column vectors. For example, meshgrid returns 3-D arrays.
[sx,sy,sz] = meshgrid(80,20:10:50,0:5:15);
whos
Name      Size         Bytes  Class
sx        4x1x4          128  double array
sy        4x1x4          128  double array
sz        4x1x4          128  double array
In addition, you could use 16-by-1 column vectors with the corresponding elements of the three arrays composing the coordinates of each starting point. (This is the equivalent of indexing the values returned by meshgrid as sx(:), sy(:), and sz(:).)
For example, adding the stream lines produces
| | Visualizing Vector Volume Data | Accessing Subregions of Volume Data | |
© 1994-2005 The MathWorks, Inc.