| Image Processing Toolbox User's Guide | |
Histogram Equalization
The process of adjusting intensity values can be done automatically by the histeq function. histeq performs histogram equalization, which involves transforming the intensity values so that the histogram of the output image approximately matches a specified histogram. (By default, histeq tries to match a flat histogram with 64 bins, but you can specify a different histogram instead; see the reference page for histeq.)
This example illustrates using histeq to adjust a grayscale image. The original image has low contrast, with most values in the middle of the intensity range. histeq produces an output image having values evenly distributed throughout the range.
Image After Histogram Equalization with Its Histogram
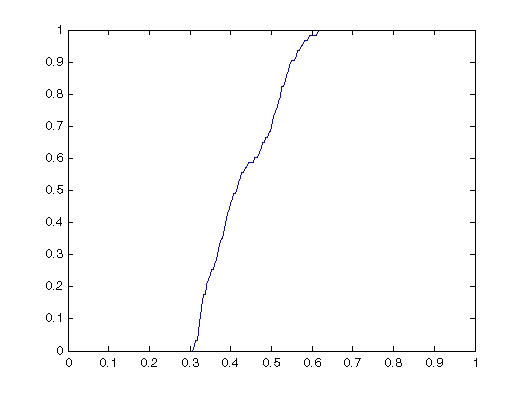
histeq can return a 1-by-256 vector that shows, for each possible input value, the resulting output value. (The values in this vector are in the range [0,1], regardless of the class of the input image.) You can plot this data to get the transformation curve. For example:
Notice how this curve reflects the histograms in the previous figure, with the input values mostly between 0.3 and 0.6, while the output values are distributed evenly between 0 and 1.
For an interactive demonstration of intensity adjustment, try running imadjdemo.
| | Adjusting Intensity Values to a Specified Range | Contrast-Limited Adaptive Histogram Equalization | |
© 1994-2005 The MathWorks, Inc.