| Image Processing Toolbox User's Guide | |
Getting the Intensity Profile of an Image
The intensity profile of an image is the set of intensity values taken from regularly spaced points along a line segment or multiline path in an image. For points that do not fall on the center of a pixel, the intensity values are interpolated.
To create an intensity profile, use the improfile function. This function calculates and plots the intensity values along a line segment or a multiline path in an image. You define the line segment (or segments) by specifying their coordinates as input arguments. You can define the line segments using a mouse.(By default, improfile uses nearest-neighbor interpolation, but you can specify a different method. For more information, see Interpolation.) improfile works best with grayscale and truecolor images.
For a single line segment, improfile plots the intensity values in a two-dimensional view. For a multiline path, improfile plots the intensity values in a three-dimensional view.
If you call improfile with no arguments, the cursor changes to crosshairs when it is over the image. You can then specify line segments by clicking the endpoints; improfile draws a line between each two consecutive points you select. When you finish specifying the path, press Return. improfile displays the plot in a new figure.
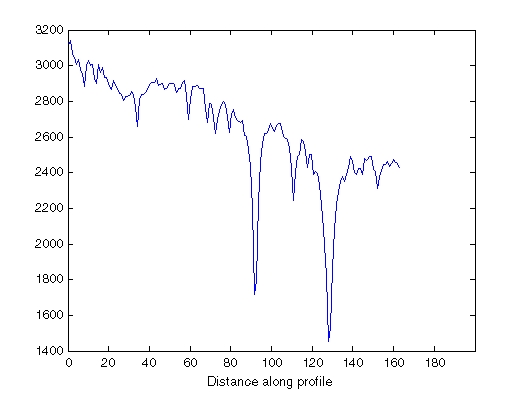
In this example, you call improfile and specify a single line with the mouse. In this figure, the line is shown in red, and is drawn from top to bottom.
improfile displays a plot of the data along the line. Notice the peaks and valleys and how they correspond to the light and dark bands in the image.
The example below shows how improfile works with an RGB image. Use imshow to display the image in a figure window. Call improfile without any arguments and trace a line segment in the image interactively. In the figure, the black line indicates a line segment drawn from top to bottom. Double-click to end the line segment.
RGB Image with Line Segment Drawn with improfile
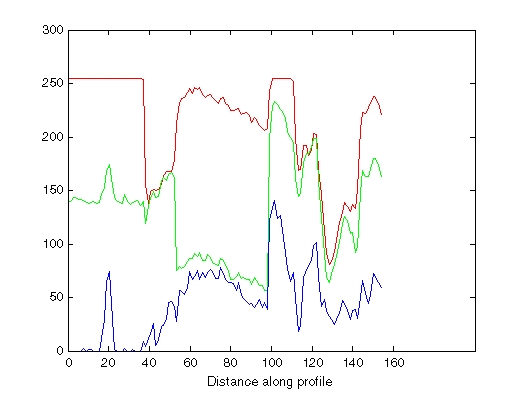
The improfile function displays a plot of the intensity values along the line segment. The plot includes separate lines for the red, green, and blue intensities. In the plot, notice how low the blue values are at the beginning of the plot where the line traverses the orange pepper.
Plot of Intensity Values Along a Line Segment in an RGB Image
| | Getting Information About Image Pixels | Displaying a Contour Plot of Image Data | |
© 1994-2005 The MathWorks, Inc.