| Image Processing Toolbox User's Guide | |
Creating an Image Histogram
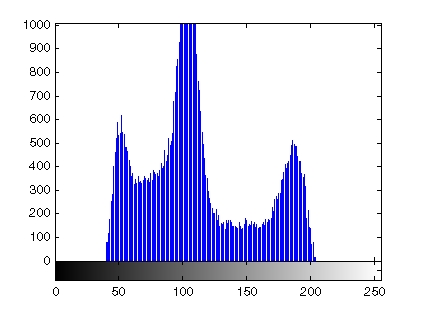
An image histogram is a chart that shows the distribution of intensities in an indexed or grayscale image. You can use the information in a histogram to choose an appropriate enhancement operation. For example, if an image histogram shows that the range of intensity values is small, you can use an intensity adjustment function to spread the values across a wider range.
To create an image histogram, use the imhist function. This function creates a histogram plot by making n equally spaced bins, each representing a range of data values. It then calculates the number of pixels within each range.
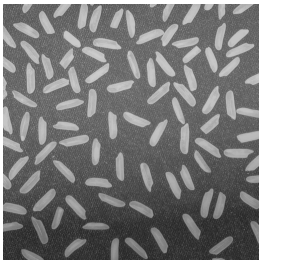
The following example displays an image of grains of rice and a histogram based on 64 bins. The histogram shows a peak at around 100, corresponding to the dark gray background in the image. For information about how to modify an image by changing the distribution of its histogram, see Adjusting Intensity Values to a Specified Range.
| | Displaying a Contour Plot of Image Data | Getting Summary Statistics About an Image | |
© 1994-2005 The MathWorks, Inc.