| Image Processing Toolbox User's Guide | |
3. View the Background Approximation as a Surface
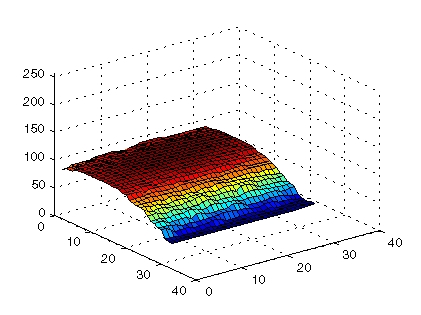
Use the surf command to create a surface display of the background approximation background. The surf command creates colored parametric surfaces that enable you to view mathematical functions over a rectangular region. The surf function requires data of class double, however, so you first need to convert background using the double command.
The example uses MATLAB indexing syntax to view only 1 out of 8 pixels in each direction; otherwise the surface plot would be too dense. The example also sets the scale of the plot to better match the range of the uint8 data and reverses the y-axis of the display to provide a better view of the data (the pixels at the bottom of the image appear at the front of the surface plot).
In the surface display, [0, 0] represents the origin, or upper left corner of the image. The highest part of the curve indicates that the highest pixel values of background (and consequently rice.png) occur near the middle rows of the image. The lowest pixel values occur at the bottom of the image and are represented in the surface plot by the lowest part of the curve.
The surface plot is a Handle Graphics® object. You can use object properties to fine-tune its appearance. For information on working with MATLAB graphics, see the MATLAB graphics documentation.
| | 2. Estimate the Value of Background Pixels | 4. Create an Image with a Uniform Background | |
© 1994-2005 The MathWorks, Inc.