| Signal Processing Toolbox |
  |
Opening the Filter Designer
Open the Filter Designer from SPTool by either:
- Pressing the New button in the Filters list in SPTool
- Selecting a filter you want to edit from the Filters list in SPTool, and then pressing the Edit button
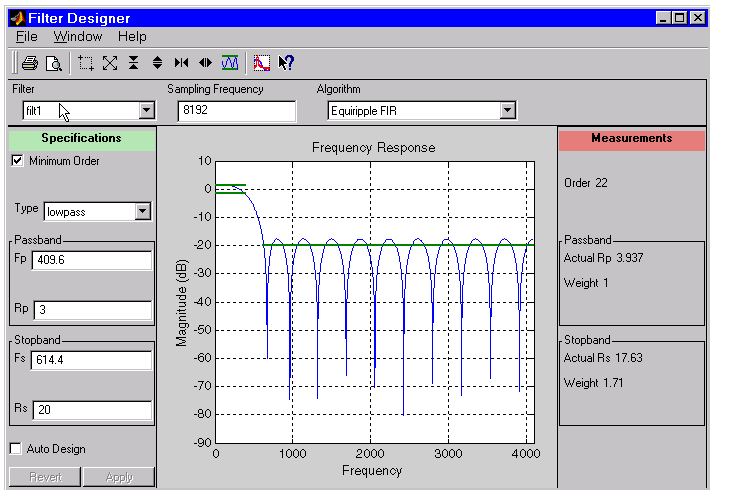
The Filter Designer has the following components:
- A pull-down Filter menu for selecting a filter from the list in SPTool
- A Sampling Frequency text box
- A pull-down Algorithm menu for selecting a filter design method or a pole-zero plot display
- A Specifications area for viewing or modifying a filter's design parameters or pole-zero locations
- A plot display region for graphically adjusting filter magnitude responses or the pole-zero locations
- A Measurements area for viewing the response characteristics and stability of the current filter
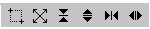
- A toolbar with the following buttons
Icon
|
Description
|

|
Print and print preview
|
|
Zoom in and out
|

|
Passband view
|

|
Overlay spectrum
|

|
Turn on the What's This help
|
| | Filter Designer | | Filter Visualization Tool | |
© 1994-2005 The MathWorks, Inc.