| Graphics | |
Setting Tick Mark Locations
MATLAB selects the tick mark location based on the data range to produce equally spaced ticks (for linear graphs). You can specify alternative locations for the tick marks by setting the XTick, YTick, and ZTick properties.
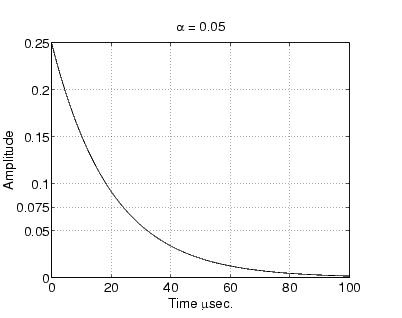
For example, if the value 0.075 is of interest for the amplitude of the function  , specify tick marks to include that value.
You can change tick labeling from numbers to strings using the XTickLabel, YTickLabel, and ZTickLabel properties.
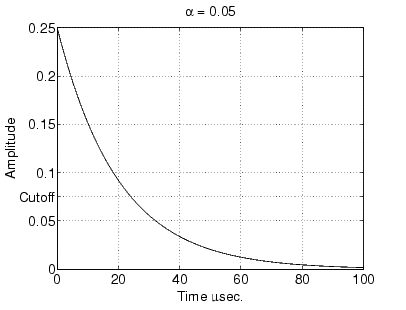
For example, to label the y-axis value of 0.075 with the string Cutoff, you can specify all y-axis labels as a string, separating each label with the "|" character.
| | Setting Axis Limits | Changing Axis Direction | |
© 1994-2005 The MathWorks, Inc.