
| Graphics |   |
Export a figure in a graphics format to a file if you want to import it into another application, such as a word processor. You can export to a file from the Windows or UNIX Export Setup dialog box or from the command line.
This section tells you how to export your figure to a file:
For further information, see Choosing a Graphics Format.
Exporting Using the Graphical User Interface
Select Export Setup from the File menu of the figure window. This displays the first of four dialog boxes that enable you to adjust the size, rendering, font, and line appearance of your figure prior to exporting it. You select each of these dialog boxes by clicking the Size, Rendering, Fonts, or Lines keyword shown to the left under Properties. For a description of each dialog box, see
Adjusting the Figure Size
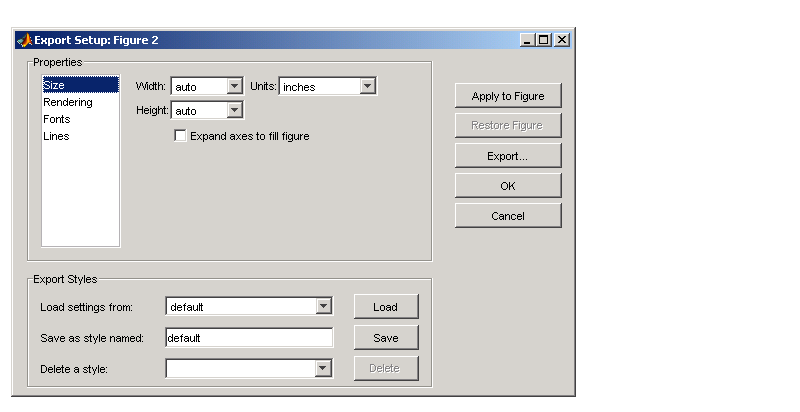
Click Size in the Export Setup dialog box to display this dialog box.

The Size dialog box, shown above, modifies the size of the figure as it will appear when imported from the export file into your application. If you leave the Width and Height settings on auto, the figure remains the same size as it appears on your screen. You can change the size of the figure by entering new values in the Width and Height text boxes and then clicking Apply to Figure. To go back to the original settings, click Restore Figure.
To save any settings that you change, or to load settings that you used earlier, see Saving and Loading Settings.
Changing the Rendering
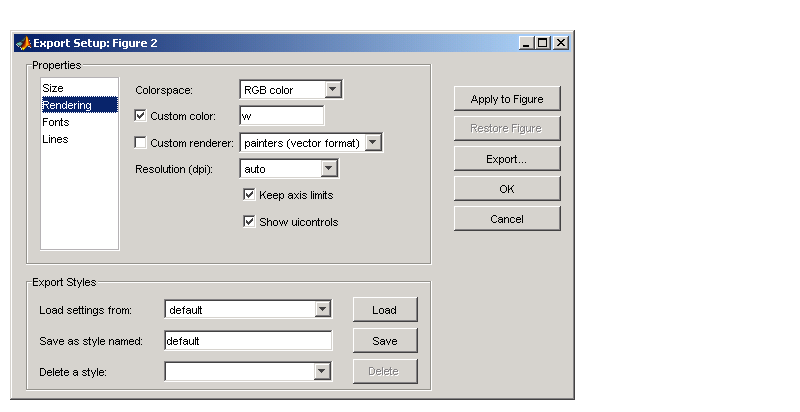
Click Rendering in the Export Setup dialog box to display this dialog box.

You can change the settings in this dialog box as follows:
Colorspace. Use the drop-down list to select a colorspace. Your choices are
Custom Color. Click the check box and enter a color to be used for the figure background. Valid entries are
white, yellow, magenta, red, cyan, green, blue, or black
w, y, m, r, c, g, b, k
colorspec for valid values. Examples: [1 0 1] is magenta. [0 .5 .4] is a dark shade of green.
Custom Renderer. Click the check box and select a renderer from the drop-down list:
Resolution. You can select one of the following from the drop-down list:
Keep axis limits. Click the check box to keep axis tick marks and limits as shown. If unchecked, have MATLAB adjust depending on figure size.
Show uicontrols. Click the check box to show all user interface controls in the figure. If unchecked, hide user interface controls.
Changing Font Characteristics
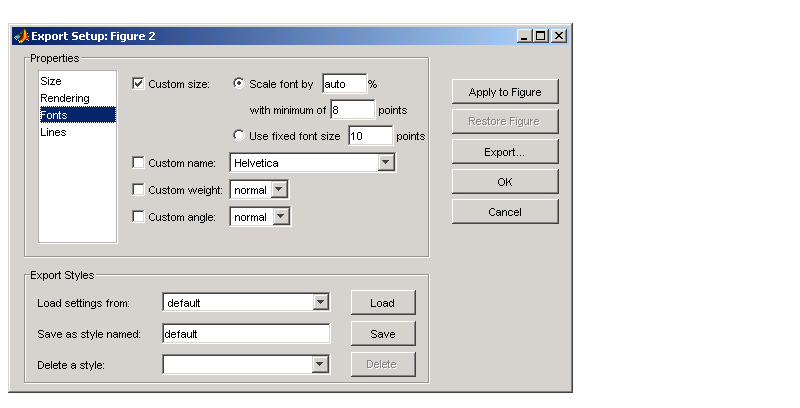
Click Fonts in the Export Setup dialog box to display this dialog box.

You can change the settings in this dialog box as follows:
Custom Size. Click the check box and use the radio buttons to select a relative or absolute font size for text in the figure.
auto to have MATLAB select the appropriate font size.
Custom Name. Click the check box and use the drop-down list to select a font name from those offered in the drop-down list.
Custom Weight. Click the check box and use the drop-down list to select the weight or thickness to be applied to text in the figure. Choose from normal, light, demi, or bold.
Custom Angle. Click the check box and use the drop-down list to select the angle to be applied to text in the figure. Choose from normal, italic, or oblique.
Changing Line Characteristics
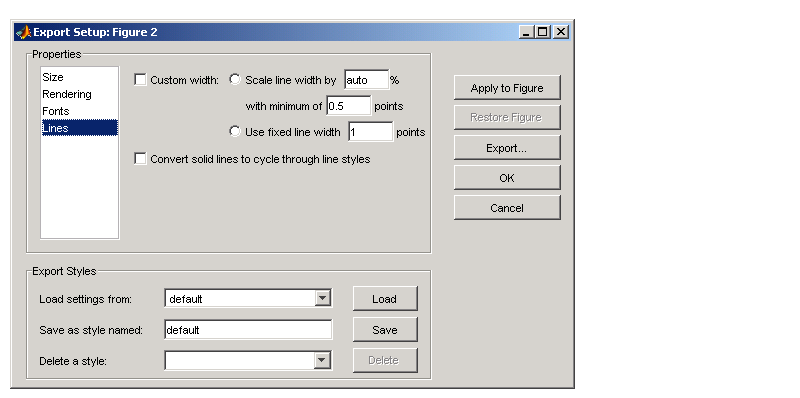
Click Lines in the Export Setup dialog box to display this dialog box.

You can change the settings in this dialog box as follows:
Custom width. Click the check box and use the radio buttons to select a relative or absolute line size for the figure.
auto to have MATLAB select the appropriate line width.
Convert solid lines to cycle through line styles. When colored graphics are imported into an application that does not support color, lines that could formerly be distinguished by unique color are likely to appear the same. For example, a red line that shows an input level and a blue line showing output both appear as black when imported into an application that does not support colored graphics.
Clicking this check box causes MATLAB to export lines using different line styles, such as solid, dotted, or dashed lines rather than differentiating between lines based on color.
Saving and Loading Settings
If you think you might use these export settings again at another time, you can save them now and then reload them later. At the bottom of each Export Setup dialog box, there is a panel labeled Export Styles. To save your current export styles, type a name into the Save as style named text box, and then click Save.
If you then click the Load settings from drop-down list, you will see the name of the style you just saved among the choices of export styles you can load. To load a style, select one of the choices from this list and then click Load.
To delete any style you no longer have use for, select that style name from the Delete a style drop-down list and click Delete.
Exporting the Figure
When you finish setting the export style for your figure, you can export the figure to a file by clicking the Export button on the right side of any of the four Export Setup dialog boxes. As new window labeled Save As opens.
Select a directory to save the file in from the Save in list at the top. Select a file type for your file from the Save as type drop-down list at the bottom, and then enter a file name in the File name text box. Click the Save button to export the file.

For information on the graphics file formats supported by MATLAB, see Choosing a Graphics Format.
Exporting Using MATLAB Commands
Use the print function to print from the MATLAB command line or from a program. See Printing and Exporting with print for basic information on printing from the command line.
To export the current or most recently active figure, type
where fileformat is a graphics format supported by MATLAB and filename is the name you want to give to the export file. MATLAB selects the filename extension, if you don't specify it.
You can also specify a number of options with the print function. These are shown in the Printing Options table on the print reference page.
For example, to export Figure No. 2 to file spline2d.eps, with 600 dpi resolution, and using the EPS color graphics format, type
Graphics file formats are explained in more detail in the sections Choosing a Graphics Format and Description of Selected Graphics Formats.
Exporting with getframe
You can use the getframe function with imwrite to export a graphic. getframe is often used in a loop to get a series of frames (figures) with the intention of creating a movie.
Some of the benefits of using this export method over using print are
getframe to capture a portion of the figure, rather than the whole figure.
imwrite offers greater flexibility for setting format-specific options, such as the bit depth and compression.
The drawbacks of using this method are that imwrite uses built-in MATLAB formats only. Therefore, you do not have access to the Ghostscript formats available to you when exporting with the print function or Export menu. Also, this technique is limited to screen resolution.
How to Use getframe and imwrite. Use getframe to capture a figure and imwrite to save it to a file. getframe returns a structure containing the fields cdata and colormap. The colormap field is empty on True Color displays. The following example captures the current figure and exports it to a PNG file.
You should use the proper syntax of imwrite for the type of image captured. In the example above, the image is captured from a True Color display. Because the colormap field is empty, it is not passed to imwrite.
Example -- Exporting a Figure Using getframe and imwrite. This example offers device independence -- it will work for either RGB-mode or indexed-mode monitors.
X=getframe(gcf);
if isempty(X.colormap)
   imwrite(X.cdata, 'myplot.bmp')
else
   imwrite(X.cdata, X.colormap, 'myplot.tif')
end
For information about available file formats and format-specific options, see the imwrite reference page. For information about creating a movie from a series of frames, see the reference pages for getframe and movie, or see Movies in Creating Specialized Plots.
Saving Multiple Figures to an AVI File
You can also save multiple figures to an AVI file using the MATLAB avifile and addframe functions. AVI files can be used for animated sequences and do not need MATLAB to run, but do require an AVI viewer. For more information, see Exporting Audio/Video Data in the MATLAB Programming documentation.
Importing MATLAB Graphics into Other Applications
You can include MATLAB graphics in a wide variety of applications for word processing, slide preparation, modification by a graphics program, presentation on the Internet, and so on. In general, the process is the same for all applications:
Edit Before You Export. Vector graphics may be fully editable in a few high-end applications, but most applications do not support editing beyond simple resizing. Bitmaps cannot be edited with quality results unless you use a software package devoted to image processing. In general, you should try to make all the necessary settings while your figure is still in MATLAB.
Importing into Microsoft Applications. To import your exported figure into a Microsoft application, select Picture from the Insert menu. Then select From File and navigate to your exported file. If you use the clipboard to perform your export operations, you can take advantage of the recommended MATLAB settings for Word and PowerPoint.
Example -- Importing an EPS Graphic into LaTeX. This example shows how to import an EPS file named peaks.eps into LaTeX.
\documentclass{article}

\usepackage{graphicx}

\begin{document}

\begin{figure}[h]
\centerline{\includegraphics[height=10cm]{peaks.eps}}
\caption{Surface Plot of Peaks}
\end{figure}

\end{document}
EPS graphics can be edited after being imported to LaTeX. For example, you can specify the height in any LaTeX-compatible dimension. To set the height to 3.5 inches, use the command
You can use the angle function to rotate the graph. For example, to rotate the graph 90 degrees, add
to the same line of code that sets the height, i.e., [height=10cm,angle=90].
 | Printing to a File | Exporting to the Windows Clipboard |  |
© 1994-2005 The MathWorks, Inc.