| Graphics | |
Combining Stem Plots with Line Plots
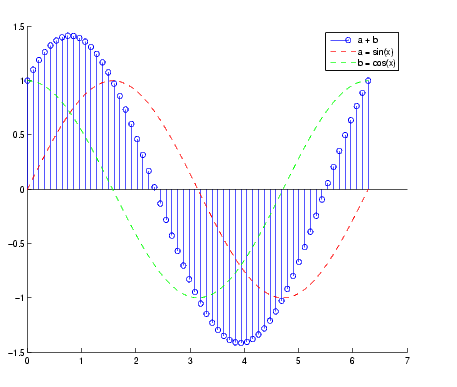
Sometimes it is useful to display more than one plot simultaneously with a stem plot to show how you arrived at a result. For example, create a linearly spaced vector with 60 elements and define two functions, a and b.
Create a stem plot showing the linear combination of the two functions.
Overlaying a and b as line plots helps visualize the functions. Before plotting the two curves, set hold to on so MATLAB does not clear the stem plot.
Use legend to annotate the graph. The stem and plot handles passed to legend identify the lines to label. Stem plots are composed of two lines; one draws the markers and the other draws the vertical stems. To create the legend, use the first handle returned by stem, which identifies the marker line.
legend_handles = [stem_handles(1);plot_handles];
legend(legend_handles,'a + b','a = sin(x)','b = cos(x)')
Labeling the axes and creating a title finishes the graph.
| | Two-Dimensional Stem Plots | Three-Dimensional Stem Plots | |
© 1994-2005 The MathWorks, Inc.