| MATLAB Function Reference | |
Syntax
stem(Y) stem(X,Y) stem(...,'fill')stem(...,LineSpec)stem(axes_handle,...) h = stem(...) hlines = stem('v6',...)
Description
A two-dimensional stem plot displays data as lines extending from a baseline along the x-axis. A circle (the default) or other marker whose y-position represents the data value terminates each stem.
stem(Y)
plots the data sequence Y as stems that extend from equally spaced and automatically generated values along the x-axis. When Y is a matrix, stem plots all elements in a row against the same x value.
stem(X,Y)
plots X versus the columns of Y. X and Y must be vectors or matrices of the same size. Additionally, X can be a row or a column vector and Y a matrix with length(X) rows.
stem(...,'fill')
specifies whether to color the circle at the end of the stem.
stem(..., specifies the line style, marker symbol, and color for the stem and top marker (the baseline is not affected). See LineSpec)
LineSpec for more information.
stem(axes_handles,...)
plots into the axes object with handle axes_handle instead of the current axes object (gca).
h = stem(...)
returns a vector of stemseries object handles in h, one handle per column of data in Y.
Backward Compatible Version
hlines = stem('v6',...)
returns the handles of line objects instead of stemseries objects for compatibility with MATLAB 6.5 and earlier.
hlines contains the handles to three line graphics objects:
hlines(1) -- The marker symbol at the top of each stem
hlines(2) -- The stem line
hlines(3) -- The baseline handle
See Plot Objects and Backward Compatibility for more information.
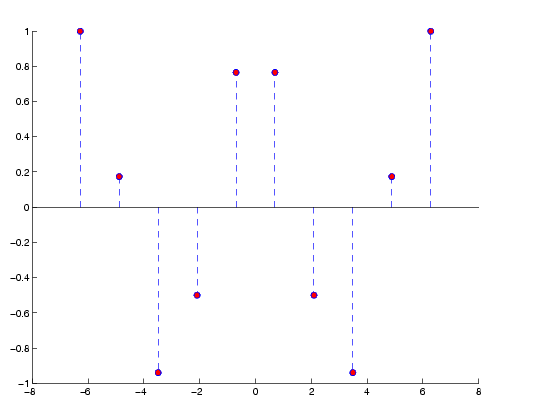
Single Series of Data
This example creates a stem plot representing the cosine of 10 values linearly spaced between 0 and 2 . Note that the line style of the baseline is set by first getting its handle from the stemseries object's
 BaseLine property.
t = linspace(-2*pi,2*pi,10);
h = stem(t,cos(t),'fill','--');
set(get(h,'BaseLine'),'LineStyle',':')
set(h,'MarkerFaceColor','red')
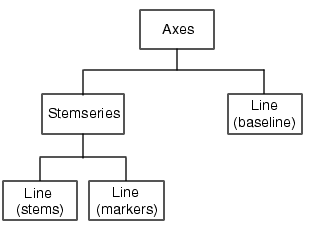
The following diagram illustrates the parent-child relationship in the previous stem plot. Note that the stemseries object contains two line objects used to draw the stem lines and the end markers. The baseline is a separate line object.
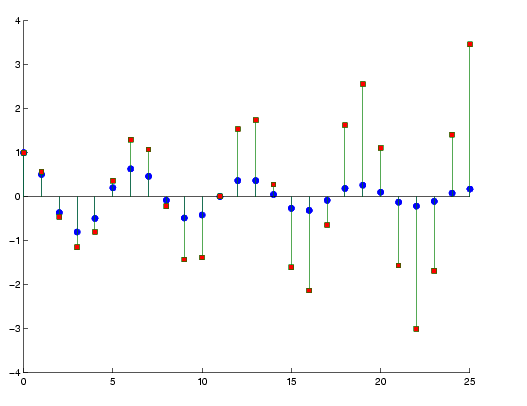
Two Series of Data on One Graph
The following example creates a stem plot from a two-column matrix. In this case, the stem function creates two stemseries objects, one of each column of data. Both objects' handles are returned in the output argument h.
h(1) is the handle to the stemseries object plotting the expression exp(-.07*x).*cos(x).
h(2) is the handle to the stemseries object plotting the expression exp(.05*x).*cos(x).
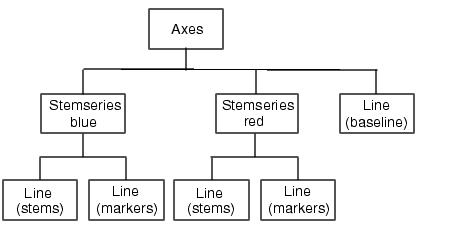
The following diagram illustrates the parent-child relationship in the previous stem plot. Note that each column in the input matrix y results in the creation of a stemseries object, which contains two line objects (one for the stems and one for the markers). The baseline is shared by both stemseries objects.
See Also
See Stemseries Properties for property descriptions
| | std | stem3 | |
© 1994-2005 The MathWorks, Inc.