| MATLAB Function Reference | |
Return coordinate and color limits for volume data
Syntax
lims = volumebounds(X,Y,Z,V)
lims = volumebounds(X,Y,Z,U,V,W)
lims = volumebounds(V), lims = volumebounds(U,V,W)
Description
lims = volumebounds(X,Y,Z,V)
returns the x,y,z and color limits of the current axes for scalar data. lims is returned as a vector:
You can pass this vector to the axis command.
lims = volumebounds(X,Y,Z,U,V,W)
returns the x, y, and z limits of the current axes for vector data. lims is returned as a vector:
lims = volumebounds(V), lims = volumebounds(U,V,W)
assumes X, Y, and Z are determined by the expression
Examples
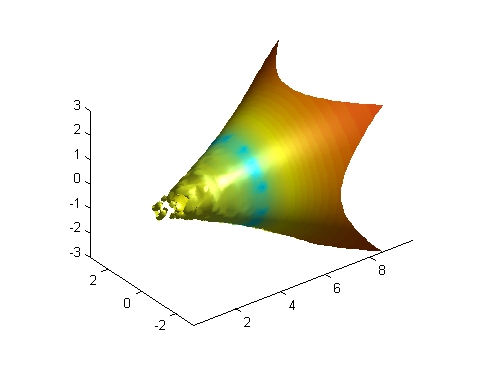
This example uses volumebounds to set the axis and color limits for an isosurface generated by the flow function.
[x y z v] = flow;
p = patch(isosurface(x,y,z,v,-3));
isonormals(x,y,z,v,p)
daspect([1 1 1])
isocolors(x,y,z,flipdim(v,2),p)
shading interp
axis(volumebounds(x,y,z,v))
view(3)
camlight
lighting phong
See Also
Volume Visualization for related functions
| | viewmtx | voronoi | |
© 1994-2005 The MathWorks, Inc.