| MATLAB Function Reference | |
Draws streamlines in slice planes
Syntax
streamslice(X,Y,Z,U,V,W,startx,starty,startz)
streamslice(U,V,W,startx,starty,startz)
streamslice(X,Y,U,V)
streamslice(U,V)
streamslice(...,density)
streamslice(...,'arrowmode')
streamslice(...,'method')
streamslice(axes_handle,...)
h = streamslice(...)
[vertices arrowvertices] = streamslice(...)
Description
streamslice(X,Y,Z,U,V,W,startx,starty,startz)
draws well spaced streamlines (with direction arrows) from vector data U, V, W in axis aligned x-, y-, z-planes starting at the points in the vectors startx, starty, startz. (The section "Specifying Starting Points for Stream Plots provides more information on defining starting points.) The arrays X, Y, Z define the coordinates for U, V, W and must be monotonic and 3-D plaid (as if produced by meshgrid). U, V, W must be m-by-n-by-p volume arrays.
You should not assume that the flow is parallel to the slice plane. For example, in a stream slice at a constant z, the z component of the vector field W is ignored when you are calculating the streamlines for that plane.
Stream slices are useful for determining where to start streamlines, stream tubes, and stream ribbons. It is good practice is to set the axes DataAspectRatio to [1 1 1] when using streamslice.
streamslice(U,V,W,startx,starty,startz)
assumes X, Y, and Z are determined by the expression
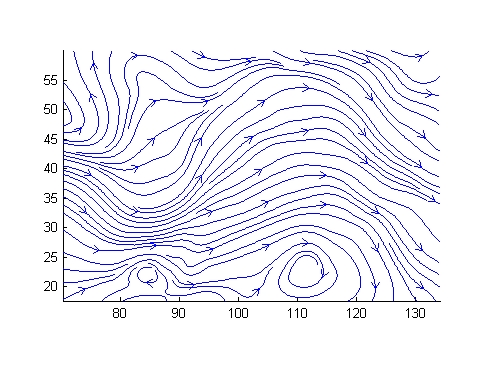
streamslice(X,Y,U,V)
draws well spaced streamlines (with direction arrows) from vector volume data U, V. The arrays X, Y define the coordinates for U, V and must be monotonic and 2-D plaid (as if produced by meshgrid).
streamslice(U,V)
assumes X, Y, and Z are determined by the expression
streamslice(...,density)
modifies the automatic spacing of the streamlines. density must be greater than 0. The default value is 1; higher values produce more streamlines on each plane. For example, 2 produces approximately twice as many streamlines, while 0.5 produces approximately half as many.
streamslice(...,' determines if direction arrows are present or not. arrowsmode')
arrowmode can be
arrows -- Draw direction arrows on the streamlines (default).
noarrows -- Do not draw direction arrows.
streamslice(..., specifies the interpolation method to use. 'method')
method can be
linear -- Linear interpolation (default)
cubic -- Cubic interpolation
nearest -- Nearest-neighbor interpolation
See interp3 for more information on interpolation methods.
streamslice(axes_handles,...)
plots into the axes object with handle axes_handle instead of the current axes object (gca).
h = streamslice(...)
returns a vector of handles to the line objects created.
[vertices arrowvertices] = streamslice(...)
returns two cell arrays of vertices for drawing the streamlines and the arrows. You can pass these values to any of the streamline drawing functions (streamline, streamribbon, streamtube).
Examples
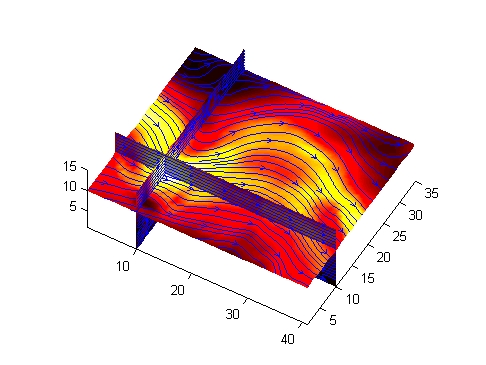
This example creates a stream slice in the wind data set at z = 5.
This example uses streamslice to calculate vertex data for the streamlines and the direction arrows. This data is then used by streamline to plot the lines and arrows. Slice planes illustrating with color the wind speed ( ) are drawn by
 slice in the same planes.
load wind
daspect([1 1 1])
[verts averts] = streamslice(u,v,w,10,10,10);
streamline([verts averts])
spd = sqrt(u.^2 + v.^2 + w.^2);
hold on;
slice(spd,10,10,10);
colormap(hot)
shading interp
view(30,50); axis(volumebounds(spd));
camlight; material([.5 1 0])
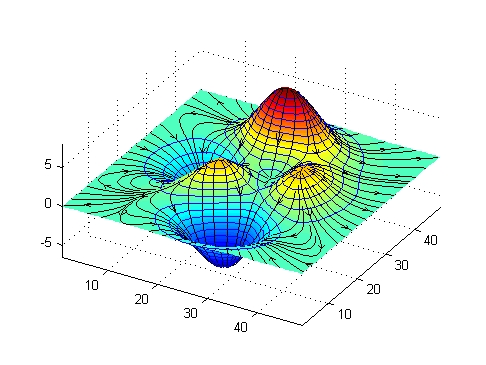
This example superimposes contour lines on a surface and then uses streamslice to draw lines that indicate the gradient of the surface. interp2 is used to find the points for the lines that lie on the surface.
z = peaks;
surf(z)
shading interp
hold on
[c ch] = contour3(z,20); set(ch,'edgecolor','b')
[u v] = gradient(z);
h = streamslice(-u,-v);
set(h,'color','k')
for i=1:length(h);
    zi = interp2(z,get(h(i),'xdata'),get(h(i),'ydata'));
    set(h(i),'zdata',zi);
end
view(30,50); axis tight
See Also
contourslice, slice, streamline, volumebounds
Volume Visualization for related functions
Specifying Starting Points for Stream Plots for related information
| | streamribbon | streamtube | |
© 1994-2005 The MathWorks, Inc.