| 3-D Visualization | |
Visualizing Functions of Two Variables
The first step in displaying a function of two variables, z = f(x,y), is to generate X and Y matrices consisting of repeated rows and columns, respectively, over the domain of the function. Then use these matrices to evaluate and graph the function.
The meshgrid function transforms the domain specified by two vectors, x and y, into matrices X and Y. You then use these matrices to evaluate functions of two variables. The rows of X are copies of the vector x and the columns of Y are copies of the vector y.
To illustrate the use of meshgrid, consider the sin(r)/r or sinc function. To evaluate this function between -8 and 8 in both x and y, you need pass only one vector argument to meshgrid, which is then used in both directions.
The matrix R contains the distance from the center of the matrix, which is the origin. Adding eps prevents the divide by zero (in the next step) that produces Inf values in the data.
Forming the sinc function and plotting Z with mesh results in the 3-D surface.
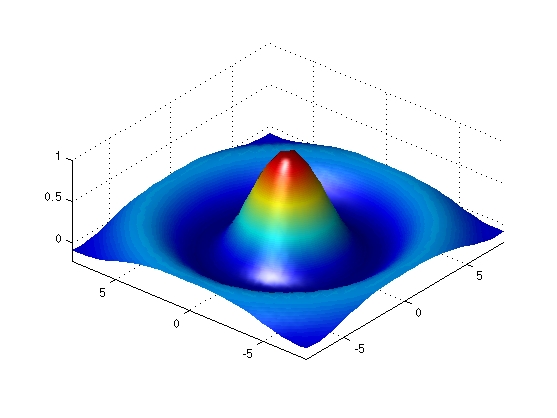
MATLAB provides a number of techniques that can enhance the information content of your graphs. For example, this graph of the sinc function uses the same data as the previous graph, but employs lighting and view adjustment to emphasize the shape of the graphed function (daspect, axis, view, camlight).
surf(X,Y,Z,'FaceColor','interp',...
    'EdgeColor','none',...
    'FaceLighting','phong')
daspect([5 5 1])
axis tight
view(-50,30)
camlight left
See the surf function for more information on surface plots.
| | Mesh and Surface Plots | Surface Plots of Nonuniformly Sampled Data | |
© 1994-2005 The MathWorks, Inc.