| 3-D Visualization | |
Surface Plots of Nonuniformly Sampled Data
You can use meshgrid to create a grid of uniformly sampled data points at which to evaluate and graph the sinc function. MATLAB then constructs the surface plot by connecting neighboring matrix elements to form a mesh of quadrilaterals.
To produce a surface plot from nonuniformly sampled data, first use griddata to interpolate the values at uniformly spaced points, and then use mesh and surf in the usual way.
Example -- Displaying Nonuniform Data on a Surface
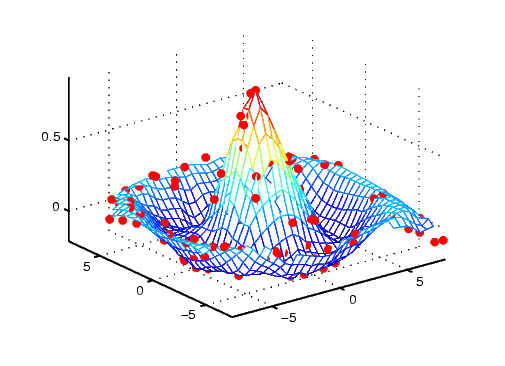
This example evaluates the sinc function at random points within a specific range and then generates uniformly sampled data for display as a surface plot. The process involves these tasks:
linspace to generate evenly spaced values over the range of your unevenly sampled data.
meshgrid to generate the plotting grid with the output of linspace.
griddata to interpolate the irregularly sampled data to the regularly spaced grid returned by meshgrid.
linspace function provides a convenient way to create uniformly spaced data with the desired number of elements. The following statements produce vectors over the range of the random data with the same resolution as that generated by the -8:.5:8 statement in the previous sinc example.
griddata to interpolate the values of the function at the uniformly spaced points, based on the values of the function at the original data points (which are random in this example). This statement uses a triangle-based cubic interpolation to generate the new data.
| | Visualizing Functions of Two Variables | Parametric Surfaces | |
© 1994-2005 The MathWorks, Inc.