| 3-D Visualization | |
Effects of Setting Aspect Ratio Properties
It is important to understand how properties interact with each other, in order to obtain the results you want. The DataAspectRatio, PlotBoxAspectRatio, and the x-, y-, and z-axis limits (XLim, YLim, and ZLim properties) all place constraints on the shape of the axes.
Data Aspect Ratio
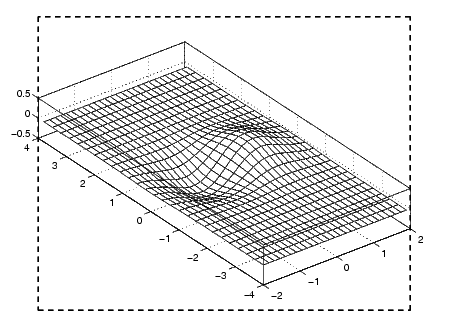
The DataAspectRatio property controls the ratio of the axis scales. For a mesh plot of the function ![]() evaluated over the range -2
evaluated over the range -2  x 2, -4 y 4
This means that four units in length along the x-axis cover the same data values as eight units in length along the y-axis and one unit in length along the z-axis. The axes fill the plot box, which has an aspect ratio of [1 1 1] by default.
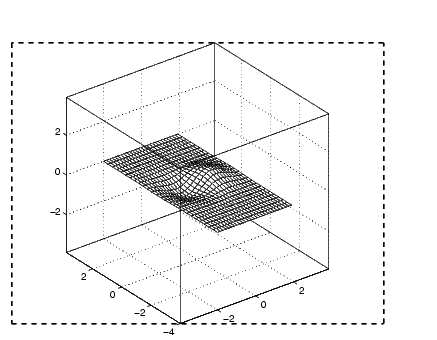
If you want to view the mesh plot so that the relative magnitudes along each axis are equal with respect to each other, you can set the DataAspectRatio to [1 1 1].
Setting the value of the DataAspectRatio property also sets the DataAspectRatioMode to manual and overrides stretch-to-fill so the specified aspect ratio is achieved.
Plot Box Aspect Ratio
Looking at the value of the PlotBoxAspectRatio for the graph in the previous section shows that it has now taken on the former value of the DataAspectRatio.
MATLAB has rescaled the plot box to accommodate the graph using the specified DataAspectRatio.
The PlotBoxAspectRatio property controls the shape of the axes plot box. MATLAB sets this property to [1 1 1] by default and adjusts the DataAspectRatio property so that graphs fill the plot box if stretching is on, or until reaching a constraint if stretch-to-fill has been overridden.
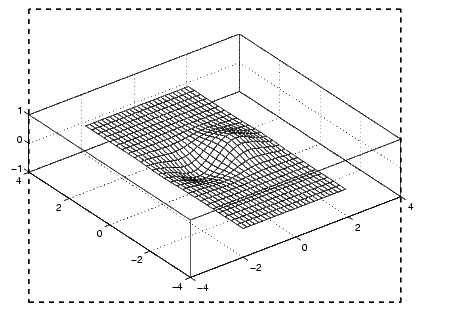
When you set the value of the DataAspectRatio and thereby prevent it from changing, MATLAB varies the PlotBoxAspectRatio instead. If you specify both the DataAspectRatio and the PlotBoxAspectRatio, MATLAB is forced to change the axis limits to obey the two constraints you have already defined.
Continuing with the mesh example, if you set both properties,
MATLAB changes the axis limits to satisfy the two constraints placed on the axes.
Adjusting Axis Limits
MATLAB enables you to set the axis limits to the values you want. However, specifying a value for DataAspectRatio, PlotBoxAspectRatio, and the axis limits overconstrains the axes definition. For example, it is not possible for MATLAB to draw the axes if you set these values:
set(gca,'DataAspectRatio',[1 1 1],...
        'PlotBoxAspectRatio',[1 1 1],...
        'XLim',[-4 4],...
        'YLim',[-4 4],...
        'ZLim',[-1 1])
In this case, MATLAB ignores the setting of the PlotBoxAspectRatio and determines its value automatically. These particular values cause the PlotBoxAspectRatio to return to its calculated value.
MATLAB can now draw the axes using the specified DataAspectRatio and axis limits.
| | Overriding Stretch-to-Fill | Example -- Displaying Cross-Sections of Surfaces | |
© 1994-2005 The MathWorks, Inc.