| 3-D Visualization | |
Connecting Equal Values with Isosurfaces
Isosurfaces are constructed by creating a surface within the volume that has the same value at each vertex. Isosurface plots are similar to contour plots in that they both indicate where values are equal.
Isosurfaces are useful to determine where in a volume a certain threshold value is reached or to observe the spatial distribution of data by selecting various isovalues at which to generate a plot. The isovalue must lie within the range of the volume data.
Create isosurfaces with the isosurface and patch commands.
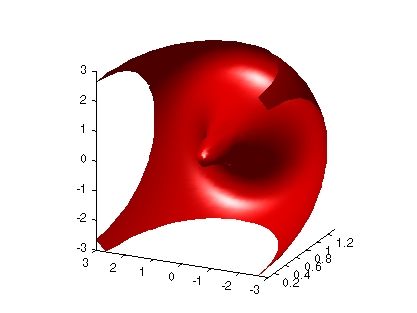
Example -- Isosurfaces in Fluid Flow Data
This example creates isosurfaces in a volume generated by the flow M-file. Generate the volume data with the command
To select the isovalue, determine the range of values in the volume data.
Through exploration, you can select isovalues that reveal useful information about the data. Once selected, use the isovalue to create the isosurface:
isosurface to generate data that you can pass directly to patch.
isonormals).
FaceColor to red and the EdgeColor to none to produce a smoothly lit surface.
daspect, view, camlight, lighting).
| | Modifying the Color Mapping | Isocaps Add Context to Visualizations | |
© 1994-2005 The MathWorks, Inc.