| Image Processing Toolbox User's Guide | |
Adding a Colorbar
To display an image with a colorbar that indicates the range of intensity values, first use the imshow function to display the image in a MATLAB figure window and then call the colorbar function to add the colorbar to the image.
When you add a colorbar to an axes object that contains an image object, the colorbar indicates the data values that the different colors in the image correspond to.
If you want to add a colorbar to an image displayed in the Image Tool, select the Print to Figure option from the Image Tool File menu. The Image Tool displays the image in a separate figure window to which you can add a colorbar.
Seeing the correspondence between data values and the colors displayed by using a colorbar is especially useful if you are displaying unconventional range data as an image, as described under Displaying Grayscale Images That Have Unconventional Ranges.
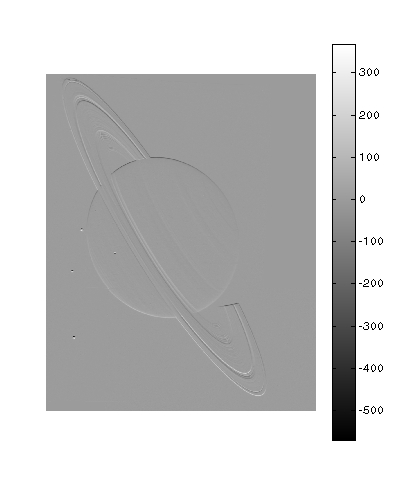
In the example below, a grayscale image of class uint8 is filtered, resulting in data that is no longer in the range [0,255].
RGB = imread('saturn.png');
I = rgb2gray(RGB);
h = [1 2 1; 0 0 0; -1 -2 -1];
I2 = filter2(h,I);
imshow(I2,'DisplayRange',[]), | | Special Display Techniques | Displaying All Frames of a Multiframe Image at Once | |
© 1994-2005 The MathWorks, Inc.