| Image Processing Toolbox User's Guide | |
Plotting the Radon Transform
You can compute the Radon transform of an image I for the angles specified in the vector theta using the radon function with this syntax.
The columns of R contain the Radon transform for each angle in theta. The vector xp contains the corresponding coordinates along the x´-axis. The center pixel of I is defined to be floor((size(I)+1)/2); this is the pixel on the x´-axis corresponding to ![]() .
.
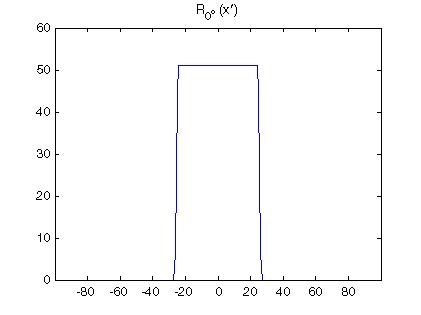
The commands below compute and plot the Radon transform at 0° and 45° of an image containing a single square object. xp is the same for all projection angles.
I = zeros(100,100); I(25:75, 25:75) = 1; imshow(I)[R,xp] = radon(I,[0 45]); figure; plot(xp,R(:,1)); title('R_{0^o} (x\prime)')
Radon Transform of a Square Function at 0 Degrees
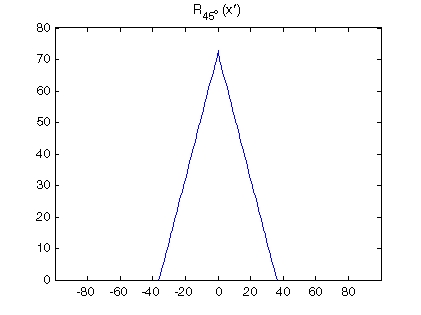
Radon Transform of a Square Function at 45 Degrees
| | Radon Transform | Viewing the Radon Transform as an Image | |
© 1994-2005 The MathWorks, Inc.