
| Wavelet Toolbox |   |
One-Dimensional Selection of Wavelet Coefficients Using the Graphical Interface
This section takes you through the features of one-dimensional selection of wavelet coefficients using one of the MATLAB Wavelet Toolbox specialized tools. The MATLAB Wavelet Toolbox provides a graphical interface tool to explore some reconstruction schemes based on various wavelet coefficients selection strategies:
For this section, switch the extension mode to symmetric padding using the command
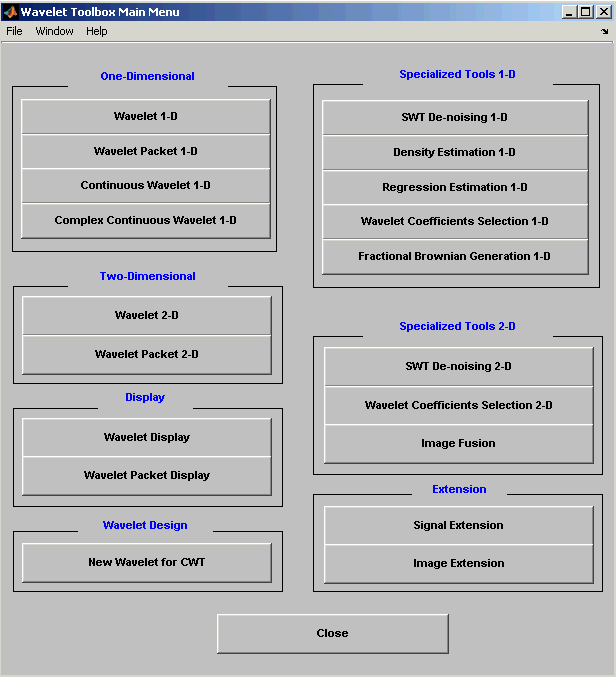
The Wavelet Toolbox Main Menu appears.

Click the Wavelet Coefficients Selection 1-D menu item. The discrete wavelet coefficients selection tool for one-dimensional signals appears.
When the Load Signal dialog box appears, select the demo MAT-file noisbump.mat, which should reside in the MATLAB directory toolbox/wavelet/wavedemo. Click the OK button. The noisy bumps data is loaded into the Wavelet Coefficients Selection 1-D tool.
db3 wavelet from the Wavelet menu and select 6 from the Level menu, and then click the Analyze button.
The tool displays below the original signal (on the left) its wavelet decomposition: the approximation coefficients A6 and detail coefficients from D6 at the top to D1 at the bottom. In the middle of the window, below the synthesized signal (which at this step is the same, since all the wavelet coefficients are kept) it displays the selected coefficients.
Selecting Biggest Coefficients Globally..
40 and press Enter. The numbers of selected biggest coefficients level by level are updated (but cannot be modified since Global is the current selection method). Then click the Apply button. The resulting coefficients are now displayed.
In the previous trial, the approximation coefficients were all kept. It is possible to relax this constraint by selecting another option from the App. cfs menu (Approximation Coefficients abbreviation). Choose the Unselect option and click the Apply button.
None of the approximation coefficients are kept.
From the App. cfs menu, select the Selectable option. Type 80 for the number of selected biggest coefficients and press Enter. Then, click the Apply button.
Selecting Biggest Coefficients by Level..
4 for the approximation and each detail, and then click the Apply button.
Selecting Coefficients Manually.
Select seven coefficients individually by double clicking each of them using the left mouse button. The color of selected coefficients switches from green to yellow for the details and from blue to yellow for the approximation, which appear on the left of the window and appear in yellow on the middle part. Click the Apply button.
You can deselect the currently selected coefficients by double clicking each of them. Another way to select or deselect a set of coefficients is to use the selection box. Drag a rubber band box (hold down the left mouse button) over a portion of the coefficient axes (original or selected) containing all the currently selected coefficients. Click the Unselect button located on the right of the window. Click the Apply button. The tool displays the null signal again.
Note that when the coefficients are very close, it is easier to zoom in before selecting or deselecting them.
Drag a rubber band box over the portion of the coefficient axes around the position 800 and containing all scales and click the Select button. Click the Apply button.
This illustrates that wavelet analysis is a local analysis since the signal is perfectly reconstructed around the position 800. Check the Show Original Signal to magnify it.
Selecting Coefficients Automatically..
Let's perform the stepwise movie using the k biggest coefficients, from k = 1 to k = 31 in steps of 1, click the Start button. As soon as the result is satisfactory, click the Stop button.
To save the synthesized signal from the present selection, use the menu option File Save Synthesized Signal. A dialog box appears that lets you specify a directory and filename for storing the signal and the wavelet name.
At the end of this section, turn back the extension mode to zero padding using the command
 | Importing and Exporting Information from the Graphical Interface | Two-Dimensional Selection of Wavelet Coefficients Using the Graphical Interface |  |
© 1994-2005 The MathWorks, Inc.