| Wavelet Toolbox | |
Example 10: A Ramp + Colored Noise
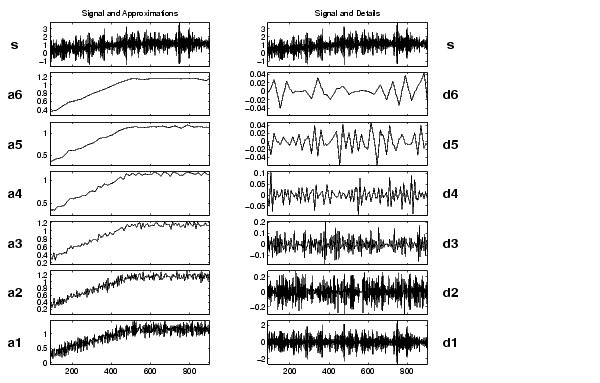
The signal is built in the same manner as in Example 9: A Ramp + White Noise, using a trend plus a noise. The trend is a slow linear increase from 0 to 1, up to t=500. Beyond this time, the value remains constant. The noise is a zero mean AR(3) noise, varying between -3 and 3 (see the analyzed signal b2). The scale of the noise is indeed six times greater than that of the ramp. At first glance, the situation seems a little bit less favorable than in the previous example, in terms of the separation between the ramp and the noise. This is actually a misconception, since the two signal components are more precisely separated in frequency.
Looking at the figure, the charts on the right show the detail decomposition of the colored noise. The charts on the left show a decomposition that resembles the one in the previous analysis. Starting at level 3, the curves provide satisfactory approximations of the ramp.
| Example 10: A Ramp + Colored Noise | |
| Addressed topics |
|
| Further exploration |
|
| | Example 9: A Ramp + White Noise | Example 11: A Sine + White Noise | |
© 1994-2005 The MathWorks, Inc.