| Graphics | |
Users typically create annotation objects from the Plot Edit toolbar or the Insert menu (select Plot Edit in the View menu to display the Plot Edit toolbar). However, you can also create annotation objects using the annotation function.
Annotation objects are created in a hidden axes that extends the full width and height of the figure. This enables you to specify the locations of annotation objects anywhere in the figure using normalized coordinates (the lower left corner is the point 0,0, the upper right corner is the point 1,1).
Annotation Object Properties
Note
You should not change any of the properties of the annotation axes or
parent any graphics objects to this axes. Use the annotation function or the
graphics tools to create annotation objects.
|
The following links access descriptions of the properties you can set on the respective annotation objects.
To modify the appearance of annotation objects created with the plotting tools, use the Property Editor.
Example -- Enclosing Subplots with an Annotation Rectangle
The following example shows how to create a rectangle annotation object and use it to highlight two subplots in a figure. This example uses the axes properties Position and TightInset to determine the location and size of the annotation rectangle.
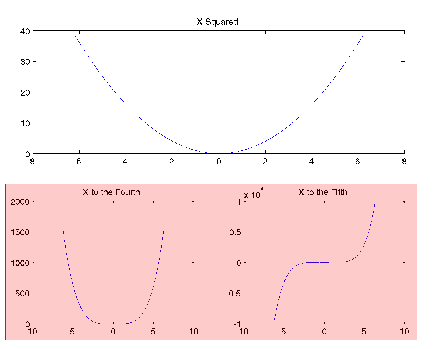
x = -2*pi:pi/12:2*pi;
y = x.^2;
subplot(2,2,1:2)
plot(x,y)
h1=subplot(223);
y = x.^4;
plot(x,y)
h2=subplot(224);
y = x.^5;
plot(x,y)
Position and TightInset properties.
p1 = get(h1,'Position');
t1 = get(h1,'TightInset');
p2 = get(h2,'Position');
t2 = get(h2,'TightInset');
x1 = p1(1)-t1(1); y1 = p1(2)-t1(2);
x2 = p2(1)-t2(1); y2 = p2(2)-t2(2);
w = x2-x1+t1(1)+p2(3)+t2(3); h = p2(4)+t2(2)+t2(4);
| | Plot Objects and Backward Compatibility | Group Objects | |
© 1994-2005 The MathWorks, Inc.