| MATLAB Function Reference | |
Compute normals of isosurface vertices
Syntax
n = isonormals(X,Y,Z,V,vertices)
n = isonormals(V,vertices)
n = isonormals(V,p), n = isonormals(X,Y,Z,V,p)
n = isonormals(...,'negate')
isonormals(V,p), isonormals(X,Y,Z,V,p)
Description
n = isonormals(X,Y,Z,V,vertices)
computes the normals of the isosurface vertices from the vertex list, vertices, using the gradient of the data V. The arrays X, Y, and Z define the coordinates for the volume V. The computed normals are returned in n.
n = isonormals(V,vertices)
assumes the arrays X, Y, and Z are defined as [X,Y,Z] = meshgrid(1:n,1:m,1:p) where [m,n,p] = size(V).
n = isonormals(V,p) and n = isonormals(X,Y,Z,V,p)
compute normals from the vertices of the patch identified by the handle p.
n = isonormals(...,'negate')
negates (reverses the direction of) the normals.
isonormals(V,p) and isonormals(X,Y,Z,V,p)
set the VertexNormals property of the patch identified by the handle p to the computed normals rather than returning the values.
Examples
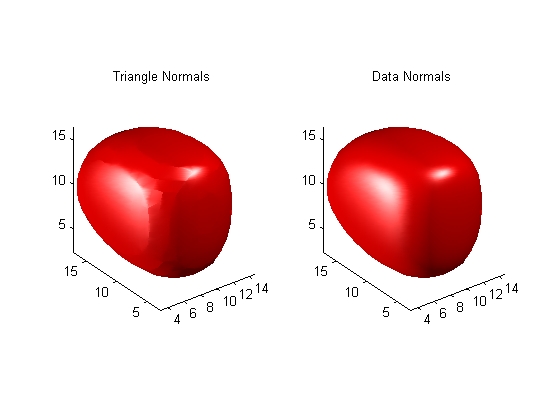
This example compares the effect of different surface normals on the visual appearance of lit isosurfaces. In one case, the triangles used to draw the isosurface define the normals. In the other, the isonormals function uses the volume data to calculate the vertex normals based on the gradient of the data points. The latter approach generally produces a smoother-appearing isosurface.
Define a 3-D array of volume data (cat, interp3):
data = cat(3, [0 .2 0; 0 .3 0; 0 0 0], ...
              [.1 .2 0; 0 1 0; .2 .7 0],...
              [0 .4 .2; .2 .4 0;.1 .1 0]);
data = interp3(data,3,'cubic');
Draw an isosurface from the volume data and add lights. This isosurface uses triangle normals (patch, isosurface, view, daspect, axis, camlight, lighting, title):
subplot(1,2,1)
p1 = patch(isosurface(data,.5),...
'FaceColor','red','EdgeColor','none');
view(3); daspect([1,1,1]); axis tight
camlight; camlight(-80,-10); lighting phong;
title('Triangle Normals')
Draw the same lit isosurface using normals calculated from the volume data:
subplot(1,2,2)
p2 = patch(isosurface(data,.5),...
    'FaceColor','red','EdgeColor','none');
isonormals(data,p2)
view(3); daspect([1 1 1]); axis tight
camlight;  camlight(-80,-10); lighting phong;
title('Data Normals')
These isosurfaces illustrate the difference between triangle and data normals:
See Also
interp3, isosurface, isocaps, smooth3, subvolume, reducevolume, reducepatch
Volume Visualization for related functions
| | isocolors | isosurface | |
© 1994-2005 The MathWorks, Inc.