| 3-D Visualization | |
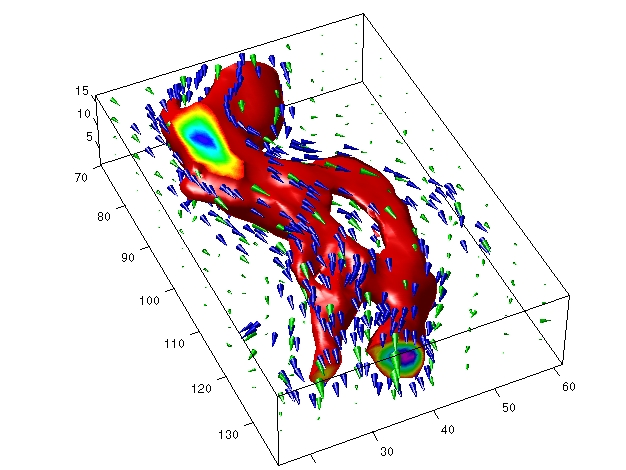
Vector Field Displayed with Cone Plots
This example plots the velocity vector cones for the wind data. The graph produced employs a number of visualization techniques:
1. Create an Isosurface
Displaying an isosurface within the rectangular space of the data provides a visual context for the cone plot. Creating the isosurface requires a number of steps:
isosurface and patch to draw an isosurface illustrating where in the rectangular space the wind speed is equal to a particular value. Regions inside the isosurface have higher wind speeds, regions outside the isosurface have lower wind speeds.
isonormals to compute vertex normals of the isosurface from the volume data rather than calculate the normals from the triangles used to render the isosurface. These normals generally produce more accurate results.
FaceColor, EdgeColor).
2. Add Isocaps to the Isosurface
Isocaps are similar to slice planes in that they show a cross section of the volume. They are designed to be the end caps of isosurfaces. Using interpolated face color on an isocap causes a mapping of data value to color in the current colormap. To create isocaps for the isosurface, define them at the same isovalue (isocaps, patch, colormap).
hcap = patch(isocaps(x,y,z,wind_speed,40),...
    'FaceColor','interp',...
    'EdgeColor','none');
colormap hsv
3. Create First Set of Cones
daspect to set the data aspect ratio of the axes before calling coneplot so MATLAB can determine the proper size of the cones.
reducepatch to reduce the number of faces and vertices (so there are not too many cones on the graph).
4. Create Second Set of Cones
linspace, meshgrid).
5. Define the View
axis command to set the axis limits equal to the minimum and maximum values of the data and enclose the graph in a box to improve the sense of a volume (box).
camproj, camzoom, view).
6. Add Lighting
Add a light source and use Phong lighting for the smoothest lighting of the isosurface (Phong lighting requires the Z-buffer renderer). Increase the strength of the background lighting on the isocaps to make them brighter (camlight, lighting, AmbientStrength).
| Creating Stream Particle Animations |
© 1994-2005 The MathWorks, Inc.