| 3-D Visualization | |
Creating Stream Particle Animations
A stream particle animation is useful for visualizing the flow direction and speed of a vector field. The "particles" (represented by any of the line markers) trace the flow along a particular stream line. The speed of each particle in the animation is proportional to the magnitude of the vector field at any given point along the stream line:
1. Specify the Starting Points of the Data Range to Plot
This example determines the region of the volume to plot by specifying the appropriate starting points. In this case, the stream plots begin at x = 100, y spans 20 to 50 and in the z = 5 plane. Note that this is not the full volume bounds.
2. Create Stream Lines to Indicate the Particle Paths
This example uses stream lines (stream3, streamline) to trace the path of the animated particles. This adds a visual context for the animation. Another possibility is to set the EraseMode property of the stream particle to none, which would be useful for a single trace through the volume.
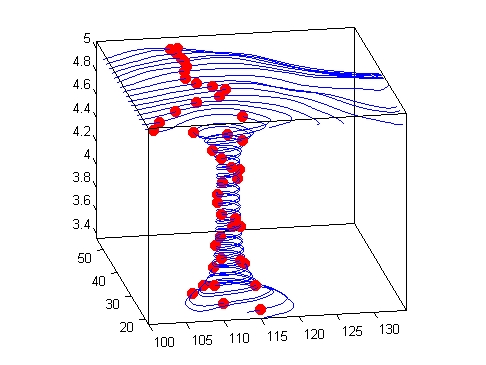
3. Define the View
While all the stream lines start in the z = 5 plane, the values of some spiral down to lower values. The following settings provide a clear view of the animation:
view) selected shows both the plane containing most stream lines and the spiral.
daspect) of [2 2 0.125] provides greater resolution in the z direction to make the stream particles more easily visible in the spiral.
axis) and draw the axis box (box).
4. Calculate the Stream Particle Vertices
The first step is to determine the vertices along the stream line where a particle should be drawn. The interpstreamspeed function returns this data based on the stream line vertices and the speed of the vector data. This example scales the velocities by 0.05 to increase the number of interpolated vertices.
Setting the axes DrawMode property to fast enables the animation to run faster.
The streamparticles function sets the following properties:
Animate to 10 to run the animation 10 times
ParticleAlignment to on to start all particle traces together
MarkerEdgeColor to none to draw only the face of the circular marker. Animations usually run faster when marker edges are not drawn.
red
Marker to o, which draws a circular marker. You can use other line markers as well.
| | Displaying Divergence with Stream Tubes | Vector Field Displayed with Cone Plots | |
© 1994-2005 The MathWorks, Inc.