| Wavelet Toolbox | |
Continuous Analysis Using the Command Line
This example involves a noisy sinusoidal signal.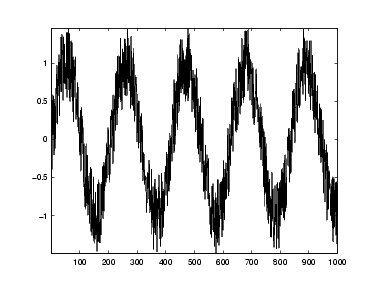
cwt command. Type
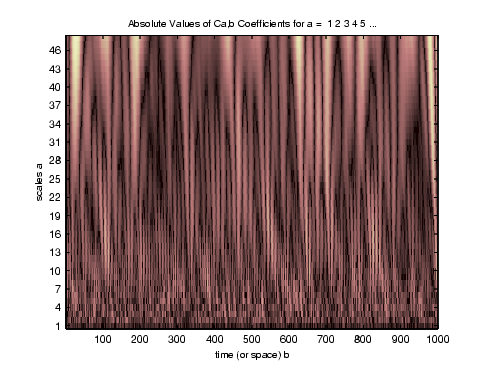
The arguments to cwt specify the signal to be analyzed, the scales of the analysis, and the wavelet to be used. The returned argument c contains the coefficients at various scales. In this case, c is a 48-by-1000 matrix with each row corresponding to a single scale.
cwt command accepts a fourth argument. This is a flag that, when present, causes cwt to produce a plot of the absolute values of the continuous wavelet transform coefficients.
The cwt command can accept more arguments to define the different characteristics of the produced plot. For more information, see the cwt reference page.
Of course, coefficient plots generated from the command line can be manipulated using ordinary MATLAB graphics commands.
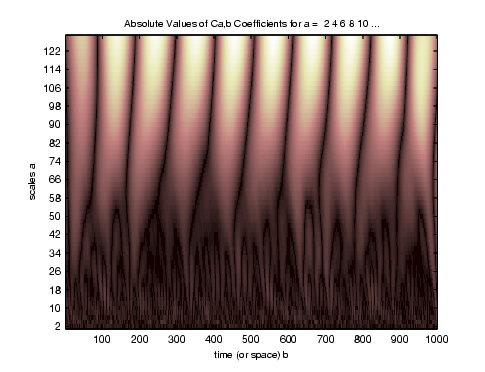
Let's repeat the analysis using every other scale from 2 to 128. Type
This plot gives a clearer picture of what's happening with the signal, highlighting the periodicity.
| | One-Dimensional Continuous Wavelet Analysis | Continuous Analysis Using the Graphical Interface | |
© 1994-2005 The MathWorks, Inc.