| Wavelet Toolbox | |
Identifying Pure Frequencies
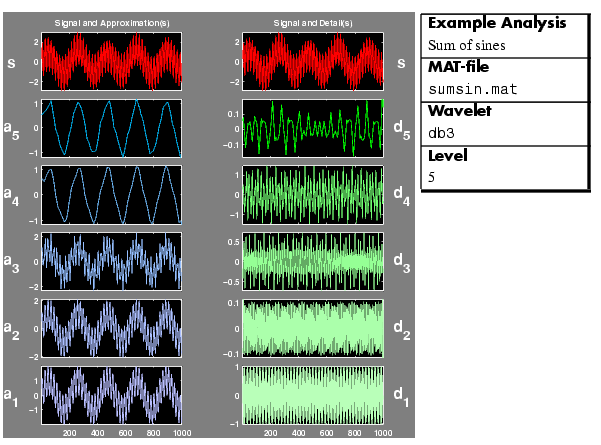
The purpose of this example is to show how analysis by wavelets can effectively perform what is thought of as a Fourier-type function -- that is, resolving a signal into constituent sinusoids of different frequencies. The signal is a sum of three pure sine waves.
Discussion
The signal is a sum of three sines: slow, medium, and rapid, which have periods (relative to the sampling period of 1) of 200, 20, and 2, respectively.
The slow, medium, and rapid sinusoids appear most clearly in approximation A4, detail D4, and detail D1, respectively. The slight differences that can be observed on the decompositions can be attributed to the sampling period.
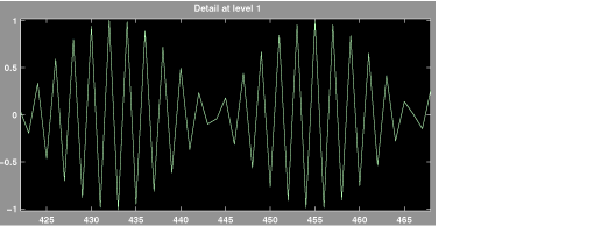
Detail D1 contains primarily the signal components whose period is between 1 and 2 (i.e., the rapid sine), but this period is not visible at the scale that is used for the graph. Zooming in on detail D1 (see below) reveals that each "belly" is composed of 10 oscillations, and this can be used to estimate the period. We indeed find that it is close to 2.
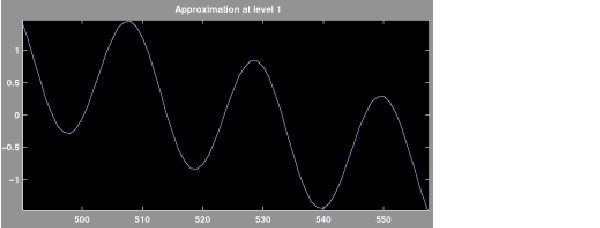
The detail D3 and (to an even greater extent), the detail D4 contain the medium sine frequencies. We notice that there is a breakdown between approximations A3 and A4, from which the medium frequency information has been subtracted. We should therefore use approximations A1 to A3 to estimate the period of the medium sine. Zooming in on A1 reveals a period of around 20.
Now only the period of the slow sine remains to be determined. Examination of approximation A4 (see the figure in Identifying Pure Frequencies) shows that the distance between two successive maximums is 200.
This slow sine still is visible in approximation A5, but were we to extend this analysis to further levels, we would find that it disappears from the approximation and moves into the details at level 8.
| Signal Component |
Found In |
Period |
Frequency |
| Slow sine |
Approximation A4 |
200 |
0.005 |
| Medium sine |
Detail D4 |
20 |
0.05 |
| Rapid sine |
Detail D1 |
2 |
0.5 |
This also can be obtained automatically using the scal2frq function, which associates pseudo-frequencies to scales for a given wavelet.
lev = [1:5]; a = 2.^lev;     % scales.
wname ='db3';
delta = 1;
f = scal2frq(a,wname,delta); % corresponding pseudo-frequencies.
per  = 1./f;                 % corresponding pseudo-periods.
| Level |
Scale |
Pseudo-Period |
Pseudo-Frequency |
1 |
2 |
2.5 |
0.4 |
2 |
4 |
5 |
0.2 |
3 |
8 |
10 |
0.1 |
4 |
16 |
20 |
0.05 |
5 |
32 |
40 |
0.025 |
In summation, we have used wavelet analysis to determine the frequencies of pure sinusoidal signal components. We were able to do this because the different frequencies predominate at different scales, and each scale is taken into account by our analysis.
| | Detecting Self-Similarity | Suppressing Signals | |
© 1994-2005 The MathWorks, Inc.