| 3-D Visualization | |
Displaying Curl with Stream Ribbons
Stream ribbons illustrate direction of flow, similar to stream lines, but can also show rotation about the flow axis by twisting the ribbon-shaped flow line. The streamribbon function enables you to specify a twist angle (in radians) for each vertex in the stream ribbons.
When used in conjunction with the curl function, streamribbon is useful for displaying the curl angular velocity of a vector field. The following example illustrates this technique:
1. Select a Subset of Data to Plot
Load and select a region of interest in the wind data set using subvolume. Plotting the full data set first can help you select a region of interest.
load wind
lims = [100.64 116.67 17.25 28.75 -0.02 6.86];
[x,y,z,u,v,w] = subvolume(x,y,z,u,v,w,lims);
2. Calculate Curl Angular Velocity and Wind Speed
Calculate the curl angular velocity and the wind speed.
3. Create the Stream Ribbons
meshgrid to create arrays of starting points for the stream ribbons. See Starting Points for Stream Plots in this chapter for information on specifying the arrays of starting points.
stream3 calculates the stream line vertices with a step size of .5.
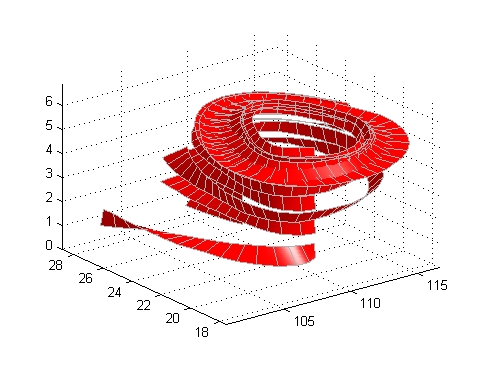
streamribbon scales the width of the ribbon by a factor of 2 to enhance the visibility of the twisting (which indicates curl angular velocity).
streamribbon returns the handles of the surface objects it creates, which are then used to set the color to red (FaceColor), the color of the surface edges to light gray (EdgeColor), and slightly increase the brightness of the ambient light reflected when lighting is applied (AmbientStrength).
4. Define the View and Add Lighting
volumebounds command provides a convenient way to set axis and color limits.
grid and set the view for 3-D (streamribbon does not change the current view).
camlight creates a light positioned to the right of the viewpoint and lighting sets the lighting method to Phong (which requires the Z-buffer renderer).
| | Stream Line Plots of Vector Data | Displaying Divergence with Stream Tubes | |
© 1994-2005 The MathWorks, Inc.