| 3-D Visualization | |
Displaying Divergence with Stream Tubes
Stream tubes are similar to stream lines, except the tubes have width, providing another dimension that you can use to represent information.
By default, MATLAB indicates the divergence of the vector field by the width of the tube. You can also define widths for each tube vertex and thereby map other data to width.
This example uses the following techniques:
wind data set
Inputs include the coordinates of the volume, vector field components, and starting locations for the stream tubes.
1. Load Data and Calculate Required Values
The first step is to load the data and calculate values needed to make the plots. These values include
x, minimum y, and a value for the altitude)
x value for the start of the stream tubes
2. Draw the Slice Planes
Draw the slice planes (slice) and set surface properties to create a smoothly colored slice. Use 16 colors from the hsv colormap.
hslice = slice(x,y,z,wind_speed,xmax,ymin,alt);
set(hslice,'FaceColor','interp','EdgeColor','none')
colormap hsv(16)
3. Add Contour Lines to Slice Planes
Add contour lines (contourslice) to the slice planes. Adjust the contour interval so the lines match the color boundaries in the slice planes:
caxis to get the current color limits.
contourslice to linear to match the default used by slice.
4. Create the Stream Tubes
Use meshgrid to create arrays for the starting points for the stream tubes, which begin at the minimum x value, range from 20 to 50 in y, and lie in a single plane in z (corresponding to one of the slice planes).
The stream tubes (streamtube) are drawn at the specified locations and scaled to be 1.25 times the default width to emphasize the variation in divergence (width). The second element in the vector [1.25 30] specifies the number of points along the circumference of the tube (the default is 20). You might want to increase this value as the tube size increases, to maintain a smooth-looking tube.
Set the data aspect ratio (daspect) before calling streamtube.
Stream tubes are surface objects, therefore you can control their appearance by setting surface properties. This example sets surface properties to give a brightly lit, red surface.
[sx,sy,sz] = meshgrid(xmin,20:3:50,alt);
daspect([1,1,1]) % set DAR before calling streamtube
htubes = streamtube(x,y,z,u,v,w,sx,sy,sz,[1.25 30]);
set(htubes,'EdgeColor','none','FaceColor','r',...
    'AmbientStrength',.5)
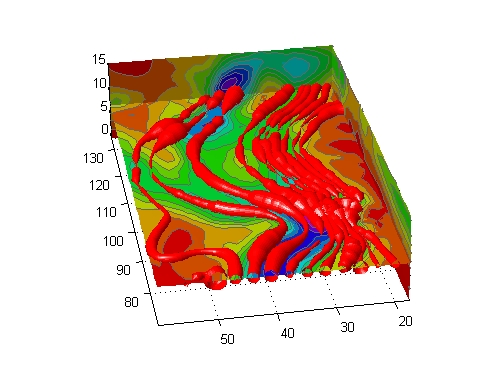
5. Define the View
The final step is to define the view and add lighting (view, axis volumebounds, Projection, camlight).
view(-100,30)
axis(volumebounds(x,y,z,wind_speed))
set(gca,'Projection','perspective')
camlight left
| | Displaying Curl with Stream Ribbons | Creating Stream Particle Animations | |
© 1994-2005 The MathWorks, Inc.