| MATLAB Function Reference | |
Creates a 3-D stream tube plot
Syntax
streamtube(X,Y,Z,U,V,W,startx,starty,startz)
streamtube(U,V,W,startx,starty,startz)
streamtube(vertices,X,Y,Z,divergence)
streamtube(vertices,divergence)
streamtube(vertices,width)
streamtube(vertices)
streamtube(...,[scale n])
streamtube(axes_handle,...)
h = streamtube(...)
Description
streamtube(X,Y,Z,U,V,W,startx,starty,startz)
draws stream tubes from vector volume data U, V, W. The arrays X, Y, Z define the coordinates for U, V, W and must be monotonic and 3-D plaid (as if produced by meshgrid). startx, starty, and startz define the starting positions of the streamlines at the center of the tubes. The section "Specifying Starting Points for Stream Plots provides more information on defining starting points.
The width of the tubes is proportional to the normalized divergence of the vector field.
Generally, you should set the DataAspectRatio (daspect) before calling streamtube.
streamtube(U,V,W,startx,starty,startz)
assumes X, Y, and Z are determined by the expression
streamtube(vertices,X,Y,Z,divergence)
assumes precomputed streamline vertices and divergence. vertices is a cell array of streamline vertices (as produced by stream3). X, Y, Z, and divergence are 3-D arrays.
streamtube(vertices,divergence)
assumes X, Y, and Z are determined by the expression
where [m,n,p] = size(divergence).
streamtube(vertices,width)
specifies the width of the tubes in the cell array of vectors, width. The size of each corresponding element of vertices and width must be equal. width can also be a scalar, specifying a single value for the width of all stream tubes.
streamtube(vertices)
selects the width automatically.
streamtube(...,[scale n])
scales the width of the tubes by scale. The default is scale = 1. When the stream tubes are created, using start points or divergence, specifying scale = 0 suppresses automatic scaling. n is the number of points along the circumference of the tube. The default is n = 20.
streamtube(axes_handles,...)
plots into the axes object with handle axes_handle instead of the current axes object (gca).
h = streamtube(...z)
returns a vector of handles (one per start point) to surface objects used to draw the stream tubes.
Examples
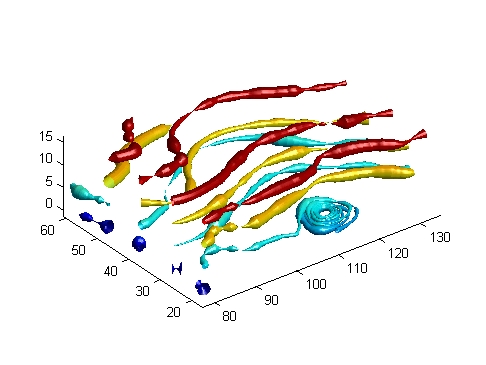
This example uses stream tubes to indicate the flow in the wind data set. Inputs include the coordinates, vector field components, and starting location for the stream tubes.
load wind
[sx sy sz] = meshgrid(80,20:10:50,0:5:15);
daspect([1 1 1])
streamtube(x,y,z,u,v,w,sx,sy,sz);
%-----Define viewing and lighting
view(3)
axis tight
shading interp;
camlight; lighting gouraud
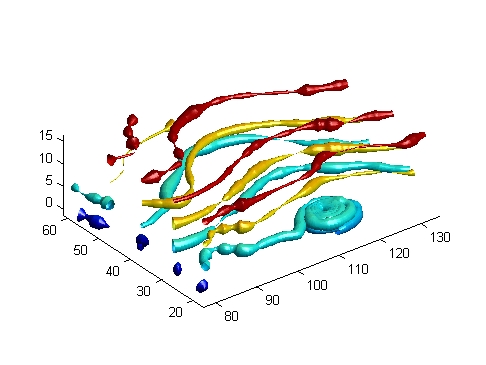
This example uses precalculated vertex data (stream3) and divergence (divergence).
load wind
[sx sy sz] = meshgrid(80,20:10:50,0:5:15);
daspect([1 1 1])
verts = stream3(x,y,z,u,v,w,sx,sy,sz);
div = divergence(x,y,z,u,v,w);
streamtube(verts,x,y,z,-div);
%-----Define viewing and lighting
view(3)
axis tight
shading interp
camlight; lighting gouraud
See Also
divergence, streamribbon, streamline, stream3
Volume Visualization for related functions
Displaying Divergence with Stream Tubes for another example
Specifying Starting Points for Stream Plots for related information
| | streamslice | strfind | |
© 1994-2005 The MathWorks, Inc.