| MATLAB Function Reference | |
Create a 3-D stream ribbon plot
Syntax
streamribbon(X,Y,Z,U,V,W,startx,starty,startz)
streamribbon(U,V,W,startx,starty,startz)
streamribbon(vertices,X,Y,Z,cav,speed)
streamribbon(vertices,cav,speed)
streamribbon(vertices,twistangle)
streamribbon(...,width)
streamribbon(axes_handle,...)
h = streamribbon(...)
Description
streamribbon(X,Y,Z,U,V,W,startx,starty,startz)
draws stream ribbons from vector volume data U, V, W. The arrays X, Y, Z define the coordinates for U, V, W and must be monotonic and 3-D plaid (as if produced by meshgrid). startx, starty, and startz define the starting positions of the stream ribbons at the center of the ribbons. The section "Specifying Starting Points for Stream Plots provides more information on defining starting points.
The twist of the ribbons is proportional to the curl of the vector field. The width of the ribbons is calculated automatically.
Generally, you should set the DataAspectRatio (daspect) before calling streamribbon.
streamribbon(U,V,W,startx,starty,startz)
assumes X, Y, and Z are determined by the expression
streamribbon(vertices,X,Y,Z,cav,speed)
assumes precomputed streamline vertices, curl angular velocity, and flow speed. vertices is a cell array of streamline vertices (as produced by stream3). X, Y, Z, cav, and speed are 3-D arrays.
streamribbon(vertices,cav,speed)
assumes X, Y, and Z are determined by the expression
streamribbon(vertices,twistangle)
uses the cell array of vectors twistangle for the twist of the ribbons (in radians). The size of each corresponding element of vertices and twistangle must be equal.
streamribbon(...,width)
sets the width of the ribbons to width.
streamribbon(axes_handles,...)
plots into the axes object with handle axes_handle instead of the current axes object (gca).
h = streamribbon(...)
returns a vector of handles (one per start point) to surface objects.
Examples
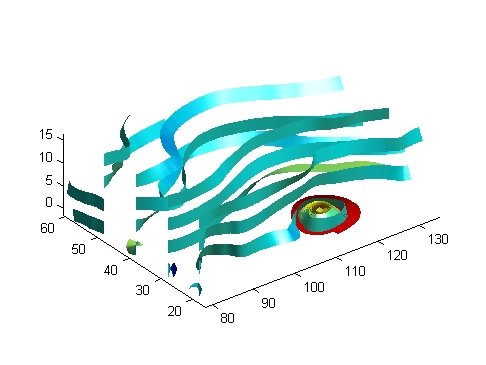
This example uses stream ribbons to indicate the flow in the wind data set. Inputs include the coordinates, vector field components, and starting location for the stream ribbons.
load wind
[sx sy sz] = meshgrid(80,20:10:50,0:5:15);
daspect([1 1 1])
streamribbon(x,y,z,u,v,w,sx,sy,sz);
%-----Define viewing and lighting
axis tight
shading interp;
view(3);
camlight; lighting gouraud
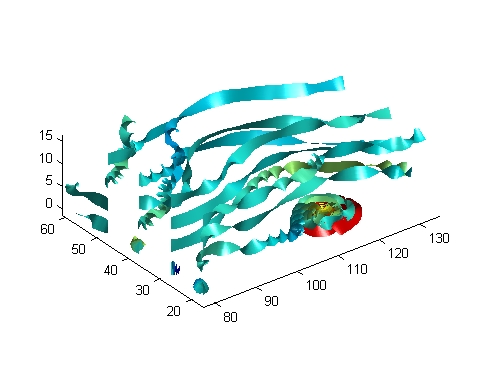
This example uses precalculated vertex data (stream3), curl average velocity (curl), and speed ( ). Using precalculated data enables you to use values other than those calculated from the single data source. In this case, the speed is reduced by a factor of 10 compared to the previous example.
load wind
[sx sy sz] = meshgrid(80,20:10:50,0:5:15);
daspect([1 1 1])
verts = stream3(x,y,z,u,v,w,sx,sy,sz);
cav = curl(x,y,z,u,v,w);
spd = sqrt(u.^2 + v.^2 + w.^2).*.1;
streamribbon(verts,x,y,z,cav,spd);
%-----Define viewing and lighting
axis tight
shading interp
view(3)
camlight; lighting gouraud
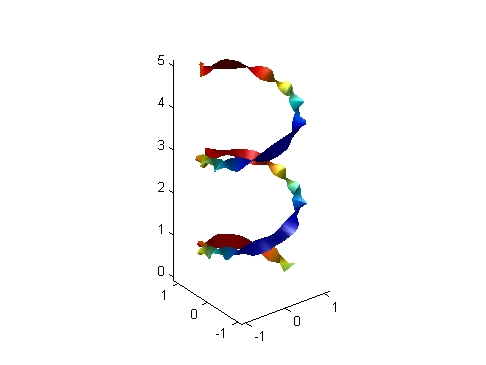
This example specifies a twist angle for the stream ribbon.
t = 0:.15:15;
verts = {[cos(t)' sin(t)' (t/3)']};
twistangle = {cos(t)'};
daspect([1 1 1])
streamribbon(verts,twistangle);
%-----Define viewing and lighting
axis tight
shading interp;
view(3);
camlight; lighting gouraud
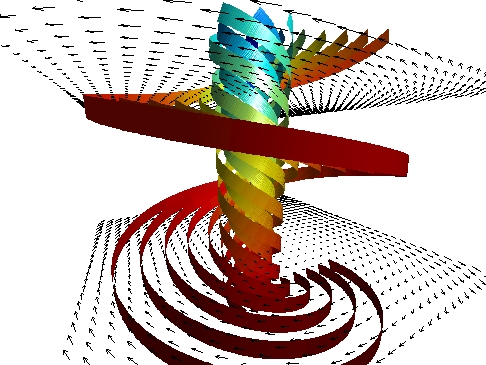
This example combines cone plots (coneplot) and stream ribbon plots in one graph.
%-----Define 3-D arrays x, y, z, u, v, w
xmin = -7; xmax = 7;
ymin = -7; ymax = 7;
zmin = -7; zmax = 7;
x = linspace(xmin,xmax,30);
y = linspace(ymin,ymax,20);
z = linspace(zmin,zmax,20);
[x y z] = meshgrid(x,y,z);
u = y; v = -x; w = 0*x+1;
daspect([1 1 1]);
[cx cy cz] = meshgrid(linspace(xmin,xmax,30),...
    linspace(ymin,ymax,30),[-3 4]);
h = coneplot(x,y,z,u,v,w,cx,cy,cz,'quiver');
set(h,'color','k');
%-----Plot two sets of streamribbons
[sx sy sz] = meshgrid([-1 0 1],[-1 0 1],-6);
streamribbon(x,y,z,u,v,w,sx,sy,sz);
[sx sy sz] = meshgrid([1:6],[0],-6);
streamribbon(x,y,z,u,v,w,sx,sy,sz);
%-----Define viewing and lighting
shading interp
view(-30,10) ; axis off tight
camproj perspective; camva(66); camlookat;
camdolly(0,0,.5,'fixtarget')
camlight
See Also
curl, streamtube, streamline, stream3
Volume Visualization for related functions
Displaying Curl with Stream Ribbons for another example
Specifying Starting Points for Stream Plots for related information
| | streamparticles | streamslice | |
© 1994-2005 The MathWorks, Inc.