| Signal Processing Toolbox | |
Syntax
Description
Hs = spectrum. returns a spectral estimation object estmethod(input1,...)
Hs of type estmethod. This object contains all the parameter information needed for the specified estimation method. Each estimation method takes one or more inputs, which are described on the individual reference pages.
Estimation Methods
Estimation methods for spectrum specify the type of spectral estimation method to use. Available estimation methods for spectrum are listed below.
spectrum.estmethod
Description
Corresponding Function
spectrum.burgBurg
pburgspectrum.covCovariance
pcovspectrum.eigenvectorEigenvector
peigspectrum.mcovModified covariance
pmcovspectrum.mtmThompson multitaper
pmtmspectrum.musicMultiple Signal Classification
pmusicspectrum.periodogramPeriodogram
periodogramspectrum.welchWelch
pwelchspectrum.yulearYule-Walker
pyulear
For more information on each estimation method, refer to its reference page.
| Note
For estimation methods that use overlap and window length inputs, you specify the number of overlap samples as a percent overlap and you specify the segment length instead of the window length. For estimation methods that use windows, if the window uses an additional parameter, a property is dynamically added to the spectrum object for that parameter. You can change that property using set (see Changing Object Properties).
|
Methods
Methods provide ways of performing functions directly on your spectrum object without having to specify the spectral estimation parameters again. You can apply these methods directly on the variable you assigned to your spectrum object. For more information on any of these methods, use the syntax help spectrum/estmethod at the MATLAB prompt.
| Method |
Options |
Description |
msspectrum |
'onesided' |
Note that the msspectrum method is only available for the periodogram and welch spectrum estimation objects.The mean-squared spectrum is intended for discrete spectra. Unlike the power spectral density ( psd), the peaks in the mean-square spectrum reflect the power in the signal at a given frequency. Hmss = msspectrum(Hs,X) returns a mean-square spectrum object containing the mean-square (power) estimate of the discrete-time signal X using the spectrum object Hs. Default for real X is the 'onesided' and for complex X is the 'twosided' Nyquist frequency range. Hmss contains a vector of normalized frequencies W at which the mean-sqaure spectrum is estimated. For real signals, the range of W is [0,pi] if the number of FFT points (NFFT) is even and [0,pi) if NFFT is odd. For complex signals, the range of W is [0,2pi).Hmss = msspectrum(Hs,X,'Fs',Fs) returns a mean-square spectrum object computed as a function of frequency, where Fs is the sampling frequency in Hz. |
Hmss = msspectrum(...,'SpectrumType','twosided') returns the two-sided mean-square spectrum. The spectrum length (NFFT) is computed over [0,2pi), or if Fs is specified, [0,Fs) . Entering 'onesided' returns the one-sided mean-square spectrum, which contains the total signal power.Hmss = msspectrum(...,'NFFT',nfft) specifes the number of FFT points to use. |
||
Hmss = msspectrum(...,'Centerdc',true) shifts the data and frequency values so that the DC component is at the center of the spectrum. The default value is false.msspectrum(...) with no output arguments plots the mean-square spectrum in dB. |
||
msspectrumopts |
Hopts = msspectrumopts(Hs) returns an object that contains options for the spectrum object Hs.Hopts = msspectrumopts(Hs,X) returns an object with data-specific options and defaults.You can pass an Hopts options object as an argument to the msspectrum method. Any indivudual option you specify after the Hopts object overrides the value in Hopts. For example, Hmss = msspectrum(Hs,X,Hopts,'SpectrumType', 'twosided') overrides the SpectrumType value in Hopts. |
|
psd |
'onesided' |
Note that music and eigenvector spectrum objects do not support the psd method. See the pseudospectrum method below.The power spectral density (PSD) is intended for continuous spectra. The integral of the PSD over a given frequency band computes the average power in the signal over that requency band. In contrast to the msspectrum, the peaks in this spectra do not reflect the power at a given frequency. See the avgpower method of dspdata for more information.Hpsd = psd(Hs,X) returns a power spectral density object containing the power spectral density estimate of the discrete-time signal X using the spectrum object Hs. The PSD is the distribution of power per unit frequency. Default for real X is 'onesided'and for complex X is 'twosided'. |
Hpsd contains a vector of normalized frequencies W at which the PSD is estimated. For real signals, the range of W is [0,pi] if the number of FFT points (NFFT) is even and [0,pi) if NFFT is odd. For complex signals, the range of W is [0,2pi).Hpsd = psd(Hs,X,'Fs',Fs) returns a power spectral density object computed as a function of frequency, where Fs is the sampling frequency in Hz.Hpsd = psd(...,'SpectrumType','twosided') returns the two-sided power spectral density of X. The spectrum length is NFFT and is computed over [0,2pi) if Fs is not specified or [0,Fs) if Fs is specified. Entering 'onesided' returns the one-sided psd, which contains the total signal power.Hpsd = psd(...,'NFFT',nfft) specifes the number of FFT points to use.Hpsd = psd(...,'Centerdc',true) shifts the data and frequency values so that the DC component is at the center of the spectrum. The default value is false.psd (...) with no output arguments plots the power spectral density estimate in dB per unit frequency. |
||
psdopts |
Hopts = psdopts(Hs) returns an object that contains options for the spectrum object Hs. See dspopts, which is simlar to psdopts, for an example.Hopts = psdopts(Hs,X) returns an object with data-specific options and defaults.You can pass an Hopts options object as an argument to the psd method. Any individual option you specify after the Hopts object overrides the value in Hopts. For example, Hpsd = psd(Hs,X,Hopts,'SpectrumType', 'twosided') overrides the SpectrumType value in Hopts. |
|
pseudospectrum |
Note that this method is used for only music or eigenvector spectrum objects.Hps = pseudospectrum(Hs,X) returns an object containing the pseudospectrum estimate of the discrete-time signal X using the spectrum object Hs. Hs must be a music or eigenvector object. Default for real X is 'half' and for complex X is the 'whole' Nyquist frequency range. Hps contains a vector of normalized frequencies W at which the pseudospectrum is estimated. For real signals, the range of W is [0,pi] if the number of FFT points (NFFT) is even and [0,pi) if NFFT is odd. For complex signals, the range of W is [0,2pi). |
|
Hps = pseudospectrum(Hs,X,'Fs',Fs) returns a pseudospectrum object computed as a function of frequency, where Fs is the sampling frequency in Hz.Hmps = pseudospectrum(...,'SpectrumRange','whole') returns the pseudospectrum over the whole Nyquist range. The spectrum length is NFFT and is computed over [0,2pi) if Fs is not specified or [0,Fs) if Fs is specified. Entering 'half' returns the pseudospectrum calculated over half the Nyquist range.Hps = pseudospectrum(...,'NFFT',nfft) specifes the number of FFT points to useHps = pseudospectrum(...,'Centerdc',true) shifts the data and frequency values so that the DC component is at the center of the spectrum. The default value is false.pseudospectrum(...) with no output arguments plots the pseudospectrum in dB. |
||
pseudospecrumopts |
Hopts = pseudospectrumopts(Hs) returns an object that contains options for the spectrum object Hs.Hopts = pseudospectrumopts(Hs,X) returns an object with data-specific options and defaults.You can pass an Hopts options object as an argument to the pseudospectrum method. Any indivudual option you specify after the Hopts object overrides the value in Hopts. For example, Hpseudospectrum= pseudospectrum(Hs,X, overrides the SpectrumRange value in Hopts. |
|
powerest |
Note that powerest is available only for music and eigenvector spectrum objects.POW = powerest(Hs,X) returns a vector POW containing estimates of the powers of the complex sinusoids in X. The input X can be a vector or a matrix. If it is a matrix it can be a data matrix, where X'*X=R or a correlation matrix R. The value the InputType property of Hs determines how X is interpreted. Hs must be a music or eigenvector spectrum object. [POW,W]=powerest(Hs,X) returns POW and a vector W of the frequencies in rad/sample of the sinusoids in X. [POW,F]=powerest(Hs,X,Fs) returns POW and a vector F of the frequencies in Hz of the sinusoids in X. Fs is the sampling frequency. |
Viewing Object Properties
As with any object, you can use get to view a spectrum object's properties. To see a specific property, use
where 'property' is the specific property name.
To see all properties for an object, use
Changing Object Properties
To set specific properties, use
where 'property1', 'property2', etc. are the specific property names.
To view the options for a property use set without specifying a value
Note that you must use single quotation marks around the property name. For example, to change the order of a Burg spectrum object Hs to 6, use
Another example of using set to change an object's properties is this example of changing the dynamically created window property of a periodogram spectrum object.
Hs=spectrum.periodogram           %Create periodogram object

Hs =

    EstimationMethod: 'Periodogram'
           FFTLength: 'NextPow2'
          WindowName: 'Rectangular'

set(Hs,'WindowName','Chebyshev')  %Change window type
Hs                                %View changed object and
                                  %Note changed property

Hs =

    EstimationMethod: 'Periodogram'
           FFTLength: 'NextPow2'
          WindowName: 'Chebyshev'
       SidelobeAtten: 100

set(Hs,'SidelobeAtten',150)       %Change dynamic property
Hs                                %View changed object

Hs =

    EstimationMethod: 'Periodogram'
           FFTLength: 'NextPow2'
          WindowName: 'Chebyshev'
       SidelobeAtten: 150
All spectrum object properties can be changed using the set command, except for the EstimationMethod property.
Another way to change an object's properties is by using the inspect command which opens the Property Inspector window where you can edit any property, except dynamic properties, such as those used with windows.
Copying an Object
To create a copy of an object, use the copy method.
Examples
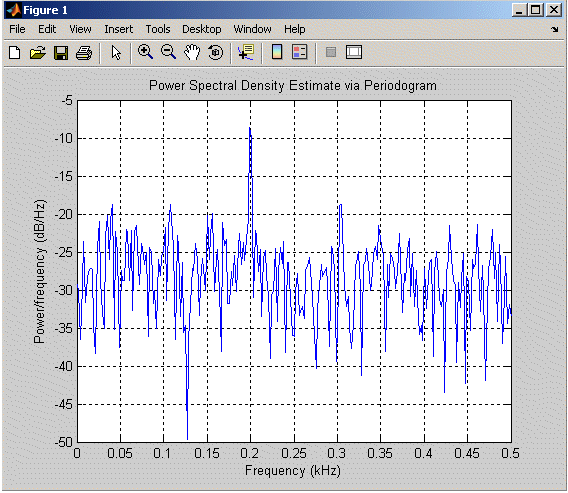
Define a cosine of 200 Hz, add some noise and then view its power spectral density estimate generated with the periodogram algorithm.
Fs = 1000;
t = 0:1/Fs:.3;
x=cos(2*pi*t*200)+randn(size(t));
Hs=spectrum.periodogram;
psd(Hs,x,'Fs',Fs)
Refer to the reference pages for each estimation method for more examples.
See Also
dspdata, dspopts, spectrum.burg, spectrum.cov, spectrum.mcov, spectrum.yulear, spectrum.periodogram, spectrum.welch, spectrum.mtm, spectrum.eigenvector, spectrum.music
| | spectrogram | spectrum.burg | |
© 1994-2005 The MathWorks, Inc.